
The Temperature and Pressure Belts of the World constitute a fundamental aspect of global climatology, providing a comprehensive framework for understanding the distribution of temperature and atmospheric pressure across the Earth’s surface. These belts form the basis for comprehending the intricate dynamics that govern weather patterns, climate variations, and the overall functioning of the Earth’s atmosphere. In the realm of geography, particularly within the context of optional studies, a nuanced exploration of these belts unveils the interconnectedness of various climatic elements and their profound impact on ecosystems, human societies, and geographic landscapes. This study becomes imperative for geographers seeking a holistic perspective on the planet’s climatic systems, enabling them to decipher the intricate tapestry of atmospheric conditions that shape the diverse environments experienced across different latitudes.
Contents
- 1 Distribution of Isolation
- 1.1 Latitudinal & seasonal Variation of Insolation
- 1.2 Polar Zone
- 1.3 Mid-Lattitude Zone
- 1.4 Tropical Zone
- 1.5 Factors Affecting the Distribution of Insolation
- 1.6 Distance between the Earth and the Sun
- 1.7 Sunspots
- 1.8 Isotherms
- 1.9 Temperature Inversion
- 1.10 Types of Temperature Inversion
- 1.11 1. Ground Inversion
- 1.12 2. Subsidence Inversion
- 1.13 Advection Inversion
- 1.14 Significance of Temperature Inversion
- 2 Frequently Asked Questions (FAQs)
Distribution of Isolation
On average, the amount of insolation received at the earth’s surface decreases from the equator
towards the pole, but there is a temporal variation of insolation received at different latitudes at
different times of the year.
| Insolation in received (%) | 10 | 20 | 30 | 40 | 50 | 60 | 70 | 80 | 90 |
Insolation in received (%) | 100 | 99 | 88 | 79 | 68 | 57 | 47 | 43 | 42 |
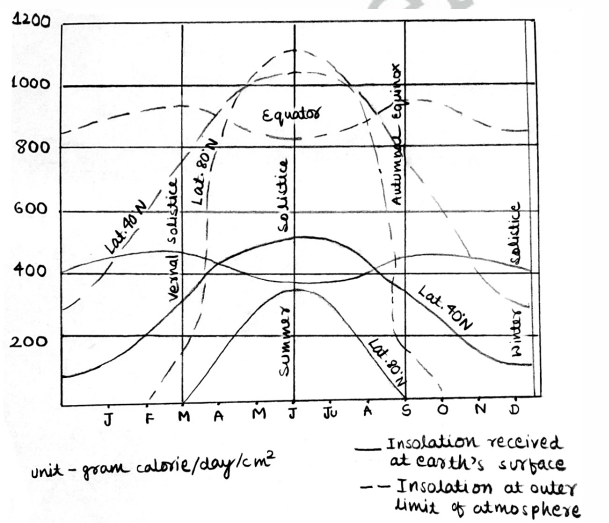
Latitudinal and seasonal variation in the amount of insolation received at the outer surface of the earth’s atmosphere (shown in broken line) and at the earth’s surface (shown by solid line)
Latitudinal & seasonal Variation of Insolation
The insolation becomes so low at the poles, that
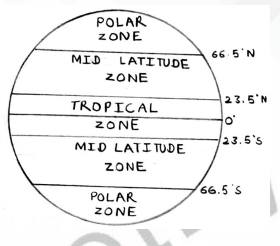
They received about 40 percent of the amount received at the equator. The tropical zone extending between the tropic of cancer (23.50 N) and Capricorn (23.5 S) receives maximum insolation. Not only this, there is very little variation of insolation during winter and summer seasons because every place within the tropics experiences overhead sun twice every year. The globe is divided into 3 zones on the basis of The amount of insolation received during the year.
Polar Zone
- Every place receives maximum and minimum insolation once during the course of a year but sometimes insolation becomes zero due to the absence of direct solar rays.
Mid-Lattitude Zone
- Insolation is never absent at any time of the year but seasonal variation increases with increasing latitude.
Tropical Zone
- All places experience the overhead sun twice during the course of a year due to the northward and southward march of the sun. The region receives the highest amount of insolation of all other zones and there is little seasonal variation.
Factors Affecting the Distribution of Insolation
Angle of the Sun’s Rays
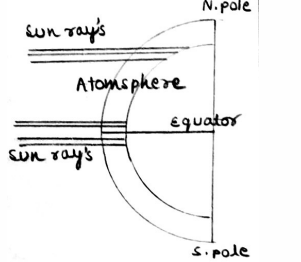
As per the rule, vertical rays bring more
insolation than oblique rays. As the angle of
the sun’s rays decreases poleward, the amount of
insolation received also decreases in that
direction. Oblique rays have to pass through
have to pass through a thicker portion of the
atmosphere than vertical rays.
Length of Day
Places having a longer length of day and vertical sun’s rays will receive maximum insolation. The shorter the duration of sunshine and longer periods of night, the lesser amount of collation received at the earth’s surface. The length of the day varies at all places except at the equator due to the inclination of the earth’s axis.
Distance between the Earth and the Sun

Earth revolves around the sun in an elliptical orbit. The average distance between the sun and the earth is about 93 million miles. At the time of perihelion on January 3 the Earth is
nearest to the sun and at the time of aphelion on July 4, it is farthest from the sun.
Winter is 7 percent less severe in January in the northern hemisphere but summer is 7 percent more intense in the southern hemisphere at the time of perihelion while Summer is 7 percent less intense in July in the northern hemisphere but winter is 7 percent more intense in the southern hemisphere at the time of aphelion.

Sunspots
Sunspots are defined as dark spots within the photosphere of the sun and are surrounded by chromospheres, disturbances, and explosions. The number of sunspots varies from year to year. The amount of insolation received at the earth’s surface decreases with a decrease in the number of sunspots due to less emission of radiation from the sun.
Isotherms
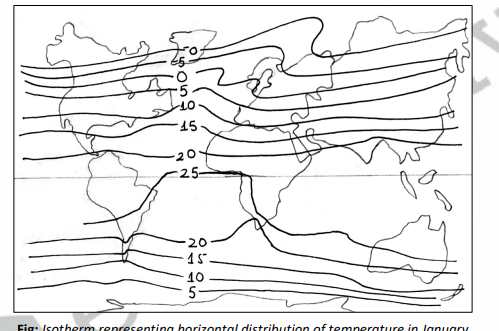
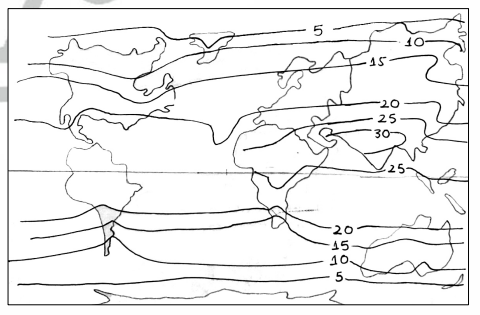
Isotherms are the imaginary lines drawn on the maps joining places of equal temperature reduced to sea level.
Characteristics of Isotherms
• It is necessary to reduce the actual temperature of all places at sea level before drawing isotherms.
• They do not represent the real temperature of the places through which they pass rather they show the temperature of the sea level
• They run east-west and are generally parallel to latitudes
• They show the horizontal distribution of temperature
• They are more irregular in the northern hemisphere because of the large extent of continents, but they are more regular in the southern hemisphere due to over dominance of oceans.
• They are generally closed-spaced in the northern hemisphere and widely spaced in the southern hemisphere.
• The closely spaced isotherm denotes the rapid rate of change of temperature and steep temperature gradient.
• The widely spaced isotherm denotes the slow rate of temperature change and low-temperature gradient.
• Isotherm on average trending from land towards the ocean bend equator wards during summer and poleward during winter.
• On the other hand, isotherm trending from the ocean to the continents bend poleward during summer and equatorward during winter.
• The isotherm during January and June, are taken as representatives for the study of horizontal distribution of temperature during winter and summer seasons respectively, because they represent seasonal extremes.
• If positive anomaly, then shifts of isotherm is polewards, and if negative anomaly, the shift of isotherm is towards equator wards.
Temperature Inversion
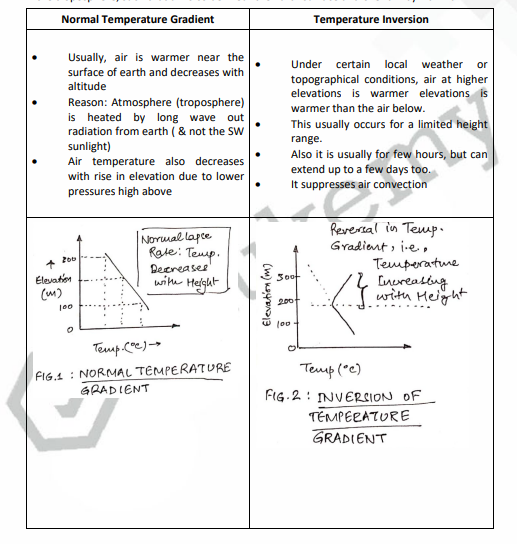
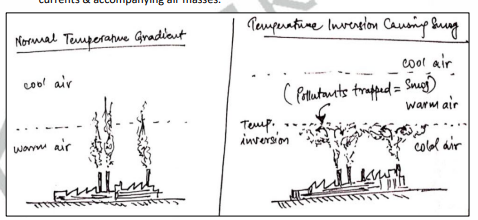
Temperature inversion is a deviation in the normally decreasing vertical temperature gradient in the troposphere, such that air is colder near the Earth’s surface and overlain by warm air.
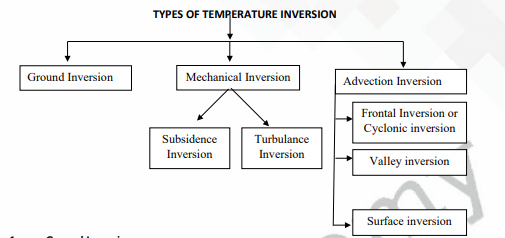
Types of Temperature Inversion
1. Ground Inversion
- Also called radiation inversion
- Occurs near the Earth’s surface.
- Occurs during long cold winter nights in mid and high-latitudes
- CAUSE/MECHANISM
- Excessive nocturnal cooling of ground due to rapid loss of heat from the ground
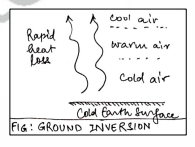
Air, near the surface in direct contact with cold earth becomes cold, while the air above does not lose heat as quickly, making it relatively warmer. Temperature inversion (cold air below, warm air above)

- Since ground inversion in static atmospheric conditions (very little movement of air), it is also called static or non-advection inversion.
- In low latitudes, it occurs only in winter heights and disappears with sunrise. Height is 30-40 ft.
- In mid-latitudes, it can persist tile noon and extend up to a few hundred feet above the surface. Thus, duration and height increase poleward.
2. Subsidence Inversion
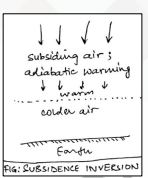
- Develops when a widespread layer of air descends.
- It is called upper air inversion as it occurs at higher altitudes.
- Mechanism
- The descending air layer is compressed: Higher pressure
- This creates adiabatic warming of this air.
- The sinking air gets warm to the point that it is warmer than the air below it.
- This can happen even hundreds of feet above the earth’s surface.
- Subsidence inversion is common over the northern continents in winter and over the subtropical oceans
- These regions generally have subsiding air because they are located under large high-pressure centers.
Advection Inversion
- Also dynamic inversion is always caused due to horizontal/ vertical movements of air.
- It is of 3 subtypes: (i) Frontal (ii) Valley (iii) surface advection inversion
(i) Frontal Inversion
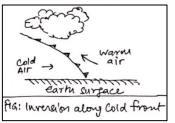
- Occurs when a cold air mass undercuts a warm air mass and lifts it aloft (at a cold front)
- Alternatively, a similar inversion can be created when a warm air mass overrides a colder one along a warm front.
- Frontal inversions have a considerable slope, whereas inversion is nearly horizontal.
- They are associated with temperate cyclones; in the Northern Hemisphere convergence of warm Westerlies with cold polar winds.
- Another point of note is that, unlike other inversions, air moisture increases upward in frontal inversion.
(ii) Surface Inversion
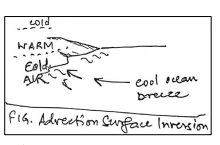
- Caused by horizontal movement of air
- Either warm air invades the area of cold air or vice versa.
- Warm air being lighter is pushed upward by the relatively denser cold air.
- For example along the Californian coast, cool ocean breeze brings cold air to the coast in summer.
(iii) Valley Inversion
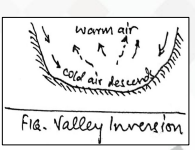
- Occurs in valleys, basins, and hollows
- It is due to radiation and vertical air movement
- At night, rapid loss of heat causes near-surface air to get cold and dense
- This air descends/drains toward the valley floor.
- Warm air further away from the surface is further pushed higher up.
- Valley inversion creates severe frosts in valley floors; hence human settlements are avoided.
- Some Brazil and apple orchards in the Himalayas avoid such frost pockets in the lower slopes of the valley.
Significance of Temperature Inversion
• FOG: the most visible consequence of inversion; it affects visibility and mobility.
Inversion in cities can trap pollutants, leading to Smog, London smog (1952).
For example: Advection fogs near Newfoundland due to the meeting of cold & warm ocean
currents & accompanying air masses.
• Frost as discussed in valley inversion affects the location of human settlements and plantations.
• Atmospheric stability: upward ascent or descent of air. It discourages rainfall and favors dry conditions. It acts as a lid and expresses convection
Frequently Asked Questions (FAQs)
1. What are the Temperature and Pressure Belts of the World?
Answer: Temperature and Pressure Belts of the World refer to distinct zones characterized by specific temperature and atmospheric pressure patterns across the Earth’s surface. These belts are a result of the unequal distribution of solar energy due to the Earth’s spherical shape and axial tilt. The primary belts include the Equatorial Low, Subtropical Highs, Subpolar Lows, and Polar Highs.
2. How do Temperature and Pressure Belts influence global weather patterns?
Answer: Temperature and Pressure Belts play a crucial role in shaping global weather patterns. The differential heating of the Earth’s surface leads to the formation of atmospheric circulation cells, such as the Hadley, Ferrel, and Polar cells. These cells drive the movement of air masses, resulting in the creation of prevailing winds, jet streams, and ocean currents. The convergence and divergence of air at these belts also contribute to the development of major climatic zones and influence regional climates.
3. Explain the significance of the Intertropical Convergence Zone (ITCZ) in the context of Temperature and Pressure Belts.
Answer: The Intertropical Convergence Zone (ITCZ) is a low-pressure belt located near the equator, where trade winds from the Northern and Southern Hemispheres converge. It is a region of intense vertical convection and heavy rainfall. The ITCZ is significant as it marks the meeting point of the Hadley cells, playing a crucial role in the Earth’s heat distribution. The movement of the ITCZ throughout the year influences the monsoons and rainfall patterns in tropical regions, impacting agriculture and the ecosystem.
In case you still have your doubts, contact us on 9811333901.
For UPSC Prelims Resources, Click here
For Daily Updates and Study Material:
Join our Telegram Channel – Edukemy for IAS
- 1. Learn through Videos – here
- 2. Be Exam Ready by Practicing Daily MCQs – here
- 3. Daily Newsletter – Get all your Current Affairs Covered – here
- 4. Mains Answer Writing Practice – here
Visit our YouTube Channel – here

