16 Apr
IPCC WG 3 – Climate Change 2022: Mitigation of Climate Change (Part I)
In News
In its latest assessment report, the Intergovernmental Panel on Climate Change (IPCC) has laid out several scenarios on the steps that ought to be taken to keep temperatures below 2°C. It warned that even temporarily exceeding the warming level of 1.5°C over the next two decades would mean additional severe impact, some irreversible.
What is the Working Group III report?
- The new report is the third part of the IPCC’s latest assessment cycle – the sixth set of “assessment reports” since its foundation in 1988. The previous set – the fifth assessment report (“AR5”) – was published in 2013-14.
- The IPCC has three working groups: Working Group I, dealing with the physical science basis of climate change; Working Group II, dealing with impacts, adaptation, and vulnerability; and Working Group III, dealing with the mitigation of climate change.
- The WG3 report is the third of these to be published, following the WG1 report in August 2021 and the WG2 report in February this year. The final part will be a synthesis report, which is slated for September.
- For WG3 specifically, the aim is to assess “the current state of knowledge on the scientific, technological, environmental, economic and social aspects of climate change mitigation”. It considers “new literature, methodological and recent developments, and changes in approaches towards climate change mitigation since the IPCC AR5 report was published in 2014”.
- For the first time, the WG3 report includes “chapters dedicated to cross-sectoral perspectives, demand, services and social aspects of mitigation and innovation, technology development and transfer”.
- It also gives “greater attention than AR5 to social, economic and environmental dimensions of mitigation actions, and institutional, legal and financial aspects”.

Note for Reader: For the convenience of readers and aspirants we have divided this report into two parts- First part discussing the current emission trends, drivers, and pathways. It also provides for sectoral analysis of emissions and their mitigation pathways.
The second part will be covering the Institutional dimensions including national and international policy, financial and technological mitigation drivers and provide the concluding way forwards.
Now, this issue of KOSMOS covers the first part, and the second part will follow in the next issue of KOSMOS.
Emissions Trends, Drivers, and Pathways
Trends in Global Emissions


Regional Variations in Total emissions, per-capita emissions, and emissions trends
- Developed countries have “sustained high levels” of per-capita emissions – more than double the per-capita emissions of Asia and the Pacific, Africa, or Latin America.
- The group of least-developed countries has the lowest emissions per capita and has contributed only a negligible proportion of historic GHG emissions growth.
- Developed countries have not managed to reduce GHG emissions substantially over the past several decades, while the bloc of “Asia and the Pacific” has rapidly increased its share of global GHG emissions since 1990, and particularly since the 2000s.

- Except for Eastern Europe and west-central Asia, emissions growth slowed across all regions of the world in 2010-19 as compared to 1990-2010. The slowing of global emissions growth was primarily triggered by substantial reductions of emissions growth in China.
- Emissions from fossil fuel combustion in the three developing regions of Asia and the Pacific, Africa and Latin America grew by 26% over the past decade, as compared to 260% growth in the prior two decades.
- The fossil fuel combustion emissions of developed countries shrank by about 10% over both of those periods.
- In countries that have succeeded in reducing their emissions, it has been a combination of “both climate and non-climate policies and factors, including structural changes have led countries to succeed in reducing their emissions.
- Most of the reductions occurred in the energy and heating sectors, while transportation emissions have continued to rise after peak emissions were reached in many cases.
Understanding socioeconomic factors as drivers of GHG Emissions
- Understanding how socioeconomic factors affect mitigation efforts is “crucial”. Report has a “long-standing discussion” on decoupling – that is to say, if economic growth can be sustained without further growth in carbon emissions or use of natural resources.
- The report cites the US, Cuba, and some EU countries as few examples of countries that have managed “absolute decoupling” of their consumption-based emissions from GDP growth over the first half of the decade.
- Between the indirect emissions of producing items and the direct emissions of energy and transportation associated with consumption, household consumption is both the largest component of a country’s GDP and the “main contributor to greenhouse gas emissions”. Consumption patterns and the associated emissions are affected by numerous factors, including socioeconomic status, access to public services and individual choice and values.
- In western countries, transportation, housing, and food consumption combined have the largest contribution to the household carbon footprint. In EU-25 countries, for example, these categories add up to 58.5% of the average household footprint. Meat-eating alone contributes 5.2% of the household footprint in the US.
- Urban and rural households also have very different consumption patterns and emissions. Urban households “tend to have higher emissions” than their rural counterparts, but with different patterns – urban households have higher emissions associated with services such as education and entertainment, while rural households have higher transportation and food emissions.
- The report also discusses emissions embodied in trade (EET) – those associated with producing goods exported from or imported into a country. An increase in trade volume over the past four decades has meant rising EET since the 1980s, with a peak in 2006.
- As of 2014, about one-quarter of global emissions are “embodied in the international trade of goods and services”. Developed countries are a major net importer of CO2 emissions, while Asia and the Pacific is the largest net exporter.
Assessing current policies and pledges vis-a-vis the action needed for limiting warming to 1.5C

Mitigation Pathways: What would it take to limit warming to 1.5 or 2C?
- The WG3 report assesses a wide range of scenarios associated with 1.5C (C1 and C2) and 2C (C3 and C4) outcomes. The lowest of these scenarios (C1), where warming is limited to 1.5C with no or limited overshoot, has become notably more difficult to achieve since the IPCC special report on 1.5C was published in 2018, due to four years of flat or modestly increasing global emissions.
- The report features five different illustrative mitigation pathways (IMP) that explore different ways the world might limit warming to 1.5C or below 2C.
- Three of the IMPs – “shifting development pathways” (SP), low demand (LD) and high renewables (Ren) – produce climate outcomes that limit warming to 1.5C with “no or limited overshoot” (C1).
- Although the report outlines various ways to limit warming to 1.5C by 2100 (C1-C2), all of these pathways show deep emissions reductions over the next few decades, with both global CO2 and all GHG emissions peaking “between 2020 and at the latest before 2025” and CO2 emissions declining between 25% (Neg - net-negative emissions (Neg)) and >50% (LD) by 2030 relative to 2020 levels.
- Overall, in scenarios staying below 1.5C with no or limited overshoot, global GHG emissions fall to 43% below 2019 levels by 2030 and 84% by 2050. In these scenarios, global CO2 falls 48% by 2030 and to net-zero “in the early 2050s”. Methane emissions fall 34% by 2030.
- The report notes that while net-zero CO2 emissions are expected to lead to relatively flat temperatures, net-zero GHG emissions result in declining global temperatures. In practice, pathways reaching net-zero GHGs tend to balance out residual non-CO2 GHG emissions with net-negative CO2 emissions.
- Even in the most ambitious emission reduction scenarios (C1), most pathways still have a limited amount of overshoot at some point in the 21st century.
- Pathways that limit warming to 1.5C with no or limited overshoot (C1) reach net-zero CO2 emissions “between 2050-2055” on average, with a range of between 2035 and 2070 across all the scenarios assessed.
- There are different mitigation strategies that can be employed to limit warming to well-below 2C. Some have a heavy reliance on renewables (Ren), a strong emphasis on energy demand reductions (LD), wide-spread deployment of CDR (Neg), or focus mitigation in the context of sustainable development (SP).
- One area where there is a lot of new focus in WG3 compared to previous reports such as the 2018 SR1.5C is low-demand scenarios. These involve a significant decoupling of material and energy demands from economic growth, resulting in very low per capita demand for energy compared to present due to increased energy efficiency and less energy intensive lifestyles.
How can shifting peoples’ demand for products and services cut emissions?
- For the first time, this IPCC WG3 report includes a chapter dedicated to the “demand, services and social aspects of mitigation”, which explores the social science literature to assess how people’s behaviour – and the choices they are offered – can cut emissions.
- “Demand-side” climate measures are those that reduce the use of high-emitting goods and services by targeting uptake of technologies and people’s consumption patterns. Examples include making it easier for people to use cleaner forms of transport or eat more plant-based foods.
- The chart below shows how this could break down between sectors, with the colored bars indicating emissions that could be avoided in 2050 by shifts in behaviour (light blue), infrastructure use (red) and clean technology adoption (orange).

- Behavioural and cultural changes represent a “substantial overlooked strategy” that have been left out of many transition pathways and scenarios. There is high agreement among researchers that such changes “hold up to gigaton-scale CO2 emissions reduction potentials”.
- Such efforts to reduce demand would significantly reduce the challenge of mitigation overall, dependence on CO2 removal, pressure on land and carbon prices needed to meet climate goals.
- Overall, the report concludes with high confidence that, by 2050, demand-side strategies could cut global greenhouse gas emissions by 40-70% compared to baseline scenarios. It also notes with high confidence that Covid-19 lockdowns demonstrated that behavioural change at a massive scale and in a short time is possible.
- The greatest potential – 8bn tonnes of CO2 equivalent (GtCO2e) avoided in 2050 – comes from changes in food demand. Land transport provides the second-biggest opportunity for emissions savings, at 6.5GtCO2e.
- The report uses the avoid-shift-improve (ASI) framework to explore options for demand-side measures, through a combination of socio-cultural, infrastructural, and technological changes.
- In the transport sector, for example, emissions could be avoided by eliminating unnecessary travel to work and working from home instead; remaining journeys could be shifted from a car to a bus; and the bus itself could be improved by replacing it with an electric model.
- Overall, choosing low-carbon options could reduce an individual’s carbon footprint by up to 9tCO2. Effective “avoid” options include not using a car and cutting back on flights, effective “shifting” includes switching to plant-based diets and using public transport, and effective “improving” includes purchasing an electric car or a heat pump.
- As demand-side solutions require both motivation and capacity for change – and motivation by people worldwide to change their energy consumption is generally low – the report states that Individual behavioural change is insufficient for climate change mitigation unless embedded in structural and cultural change.
- Behavioural nudges can be used to encourage the uptake of everything from food waste reduction to using geothermal for district heating. The Report highlights effective measures including “green defaults”, such as automatic enrolment in clean energy provision, and clear labelling of products with climate-relevant information.
- On demand-side measures, the report also considers proposed “transformative megatrends”, namely the “sharing economy”, the “circular economy” and “digitalization”. Examples of these ideas are shown in the figure below.

- A key concern about policies focused on cutting emissions is that they may reduce people’s quality of life, but the report finds that “decent living standards” – a benchmark of minimum material conditions for human wellbeing – for everyone are achievable through the implementation of high-efficiency low demand mitigation pathways.
- The report cites a low energy demand scenario that delivers universal decent living standards while cutting final energy demand by 40% between 2018 and 2050.
- It adds that addressing inequality supports climate change mitigation efforts and notes with high confidence that demand-side measures come with “multiple interacting benefits” – for example, improvements to nutrition and health.
IPCC WG 3 – Climate Change 2022: Mitigation of Climate Change (Part I)
Sectoral Perspective of GHG Emission and Mitigation Strategies

What needs to be done to mitigate food sector emissions?
Mitigating food-sector emissions to their full potential requires change at all stages, from producer to consumer and waste management via integrated packages of policy including supply- and demand-side measures.
- Supply-side measures: Sustainability in food production and value chains requires significant cross-sectoral action, from better agricultural practices, consumers changing their diets, and food producers, distributors, retailers, and consumers reducing food waste.
- Demand-side measures: Shifting consumption towards plant-based diets has high mitigation potential. Shifts to sustainable healthy diets such as high in plant protein and low in meat and dairy have a “technical potential” to reduce emissions by 3.6GtCO2e.
- Role of technology: Emerging technologies such as plant-based alternatives to animal products, cultured meat, and controlled environment agriculture (hydroponic or aquaponic cultivation systems) could bring substantial reduction in direct GHG emissions from food production. These technologies typically have lower water, land, and nutrient footprints, but some of them are energy intensive.
- Food loss and waste reduction: Reducing food loss and waste globally has the technical potential to cut emissions globally by 2.1GtCO2e, with a range of 0.1-5.8GtCO2e.

Way forward: Changes in the food sector would have broad implications. Key enablers for these shifts could include creating “novel narratives” in the media and entertainment industry to help to break away from the established values, discourses and the status quo.
The report explores other measures to influence choices in the food sector, including taxes or carbon pricing on food, both of which would be regressive, meaning they disproportionately burden poorer members of society. Instead, it points to options including marketing regulations, procurement policies, dietary guidelines, labelling and “nudges”.

How must global energy systems change to limit warming?
Warming cannot be limited to 2C or 1.5C without rapid and deep reductions in energy system CO2 and GHG emissions. This means the energy systems of the future will be “very different”.
- Low- carbon energy transition: Shifting to low-carbon energy alternatives will help in cutting down the emissions and could save money, thanks to rapid cost reductions in key technologies over the past decade. This will have multiple co-benefits, including improvements in air quality and health.
- However, there are a range of challenges for low-carbon energy systems. For example, integrating large amounts of variable renewable energy (VRE), particularly wind and solar, presents economic and technical challenges to electricity system management.
- These challenges can be addressed by using batteries, hydrogen, and other storage etc.
- Action on fossil fuel installations: Decommissioning and reduced utilization of existing fossil fuel installations in the power sector as well as cancellation of new installations are required to align future CO2 emissions from the power sector.
- Limiting warming to 2C or below requires a rapid shift away from coal use without carbon capture and storage (CCS). It will require cancellation of new coal power projects and accelerated retirement of existing coal plants and limiting the construction of new gas-fired power plants.
- Nuclear energy: Nuclear can deliver low-carbon energy at scale, but it will require improvements in managing construction of reactor designs that hold the promise of lower costs and broader use. Nuclear power continues to be affected by cost overruns, high upfront investment needs, challenges with final disposal of radioactive waste, and varying public acceptance and political support levels.
- Hydrogen energy: The report has highlighted the growing interest in hydrogen energy. It points to the use of hydrogen in sectors that are hard to decarbonize, such as parts of transport and industry, as well as for storage in low-carbon electricity systems.

Conclusion: Finally, the report says that while climate change will alter hydropower output, bioenergy yields, the efficiency of fossil and nuclear power plants, and demand for heat and cooling, it will not affect wind and solar resources to the extent that it would compromise their ability to reduce emissions.
3. Land and Climate Change Mitigation
Contribution of land to GHG emissions
- Around 22% of global greenhouse gas emissions came from agriculture, forestry, and other land use (AFOLU) in 2019.
- The proportional contribution of AFOLU to total emissions varies regionally. It is highest in Latin America and the Caribbean, where 58% of total emissions come from AFOLU and lowest in Europe and North America, where 7% of emissions come from AFOLU.
- Deforestation: CO2 emissions from AFOLU are largely driven by land-use change, with deforestation accounting for about half of total emissions.
- Levels of deforestation generally declined between 2010 and 2019. However, over this time, there were overall losses in tropical forests – which are key for carbon storage and biodiversity – and gains in temperate and boreal regions.
- The factors such as law enforcement, protected areas, payment for ecosystem services and the presence of Indigenous people were consistently associated with lower levels of deforestation.
- By contrast, higher agricultural prices and proximity to agriculture, urban areas and roads were consistently associated with higher levels of deforestation.
- Loss of mangroves: The loss of mangrove forests – coastal swamps found in the tropics that hold vast stores of carbon – has been particularly severe over the past few decades.
- From 1990 to 2020, one million hectares of mangrove forests were lost across the world, largely due to conversion for agriculture and aquaculture. (There are around 15m hectares of mangrove forests globally.)

- Methane and Nitrous oxide emissions: In addition to CO2, the report also examines how the AFOLU sector is driving emissions of the second- and third-most polluting greenhouse gases, namely, methane and nitrous oxide.
- Methane emissions from AFOLU increased between 2010 and 2019, with the main source being belching and manure production from livestock.
- Nitrous oxide emissions are also on the rise, dominated by agriculture, notably from manure application, nitrogen deposition and nitrogen fertilizer use.
Significance of AFOLU sector in climate change mitigation:
- Despite dramatic land-use change, the world’s intact terrestrial ecosystems acted as a carbon sink between 2010 and 2019, absorbing around a third of all human-caused CO2 emissions.
- There is robust evidence that the AFOLU sector could provide 20-30% of the global greenhouse gas reductions needed for a 1.5C or 2C pathway by 2050.
- AFOLU’s contribution to climate targets could come at a relatively low cost.
- AFOLU sector could economically remove 8-16GtCO2e every year between 2020 and 2050. This “economic potential” is roughly half the “technical potential” from AFOLU – an estimate of what would technically be possible when constraints such as financing are not considered.
- From now to 2050, protecting and restoring forests and other ecosystems could have the highest potential for economic greenhouse gas removal related to AFOLU.

- The above measures for slashing AFOLU’s climate impact are available and ready to deploy, in contrast to other types of CO2 removal, such as carbon capture and storage (CCS).
Barriers to land-based climate measures: The economic and political feasibility of land-based climate measures are hampered by persistent barriers such as-
- Availability of finance: The world currently spends $700m on land-based climate measures each year – well short of the $400bn needed if the AFOLU sector is to deliver up to 30% of the CO2 cuts needed to meet climate targets.
- Other barriers: Differences in cultural values, governance, accountability, and institutional capacity are also important barriers.
- Deployment of land-based climate measures depends strongly on policies that directly address emissions. Examples of successful policies include community forestry, biodiversity conservation and payments for ecosystem services.
Conclusion:
- Depending on local conditions and management strategies, mitigation measures have the potential to positively or negatively impact biodiversity, ecosystem functioning, air quality, water availability and quality, soil productivity, rights infringements, food security, and human wellbeing.
- Poorly planned deployment of biomass production and large-scale tree-planting may conflict with environmental and social dimensions of sustainability.
4. CO2 Removal and Solar Geoengineering
Significance of CO2 removal in achieving net-zero:
- Net-zero can only be achieved if CO2 removal is used to balance “difficult-to-abate” emissions from sectors that will find it harder to slash their climate impact, such as aviation, agriculture and some industrial processes.
- In the longer term, up scaling CO2 removal could provide net-negative CO2 emissions at the global level, allowing a reversal of global warming.
Methods for CO2 removal and their current status around the globe:
- Methods for CO2 removal range from the biological, such as tree-planting and Bioenergy with carbon capture and storage (BECCS), to the chemical, such as using machines to suck CO2 from air (direct air capture and storage). Each method’s ability to store CO2 ranges from decades to more than 10,000 years.
- The info graphic sums up various land- and ocean-based methods for removing CO2 from air, including possible implementation and storage options.


Solar geoengineering- Introduction
- Solar geoengineering, or solar radiation management (SRM) is a proposed type of climate engineering in which sunlight (solar radiation) would be reflected back to space to limit or reverse human-caused climate change.
- All types of solar geoengineering are united by their goal of limiting the effect of sunlight on the Earth, but they vary widely in their approach.
- Possible methods include reducing heat-trapping clouds, sending a giant sunshade up into orbit or releasing aerosols into the stratosphere.
- Hypothetical research has shown that solar geoengineering has the potential to offset some of the effects of increasing greenhouse gas emissions, including increases in extreme temperatures and rainfall, melting of Arctic sea ice and glaciers and changes in frequency and intensity of tropical storms.
Criticism against solar geoengineering:
- There is high agreement among research papers that solar geoengineering cannot be the main policy response to climate change and is, at best, a supplement to achieving sustained net-zero.
- SRM contrasts with climate-change mitigation activities, such as emission reductions and CDR, as it introduces a ‘mask’ to the climate change problem by altering the Earth’s radiation budget, rather than attempting to address the root cause of the problem, which is the increase in greenhouse gas emissions in the atmosphere.
- It adds that the effects of solar geoengineering would only last as long as deployment is maintained.
- There has been some limited research into how solar geoengineering might pose risks to humans and wildlife.
- Solar geoengineering via artificial aerosol release is projected to deplete the ozone layer, increasing deaths from skin cancer.
- It adds that solar geoengineering may drive changes in risk from infectious diseases and food security, depending on how it is deployed.
- The solar geoengineering may also introduce novel risks for international collaboration and peace. Conflicting temperature preferences between countries may lead to counter-geoengineering measures, such as deliberate release of warming agents or destruction of deployment equipment.

Transforming urban landscape to address climate change mitigation:
- Determining the drivers of greenhouse gas emissions in cities is complex and involves understanding the interplay of population size, income, state of urbanization and how cities are laid out.
- Urban areas can significantly reduce emissions through the systemic transition of infrastructure and urban form (how cities are laid out) through low-emission development pathways.
- However, it adds that cities can achieve net-zero emissions only if emissions are reduced within and outside of their administrative boundaries through supply chains, which will have beneficial cascading effects across other sectors.
- Three broad mitigation strategies (adjacent infographic) have been found to be effective when implemented concurrently in cities.
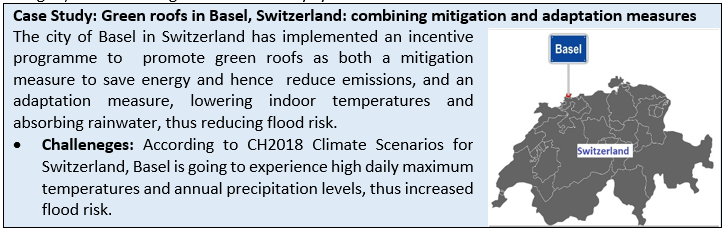
- Green and blue infrastructure, such as urban forests and green roofs, can mitigate climate change through sequestration, avoided emissions and reduced energy use because of cooling, with co-benefits for physical and mental health and better air quality for city-dwellers.
- Global urban trees store approximately 7.4bn tonnes of carbon and sequester approximately 217m tonnes of carbon annually.


- Cities that use spatial planning to become more compact and resource-efficient could reduce GHG emissions between 23-26% by 2050. This include reducing the distance between houses and job centers, shifting towards walking and low-emissions public transport, promoting urban green infrastructure and energy-efficient buildings.
- Buildings and climate change mitigation: Up to 61% of global building emissions (8.2 GtCO2) could be cut by 2050: energy efficiency policies contribute 42% to this potential, renewable energy policies 9% and “sufficiency policies” that help avoid energy, water, material and land-use contribute 10%.
- Developing countries offer the largest share of mitigation potential for new buildings, while the highest potential for developed countries is in retrofitting existing buildings.
- Besides just the built environment, there are several options to mitigate buildings’ footprints: using more daylight, electric lighting, energy-efficient household appliances, insulation materials, indirect evaporative cooling, smart meters, and grids to implement renewable electricity sources.
- However, some mitigation and adaptation measures have trade-offs: high-density areas that lack provisions for green and open spaces may intensify the “urban heat island” effect, for example.
- Urban poor and climate change mitigation: The urban poor stand to be disproportionately affected by climate change. However, mitigation measures such as storm-water management and urban greening can enhance social equity and environmental justice.
Way forward: The cities can only achieve net-zero emissions through deep decarburization and systemic transformation.
- There is an urgent need to integrate mitigation and adaptation for cities to address climate change and withstand its effects, given current and increasing extreme climatic events.
- But achieving this “transformational change” will require engaging with multiple scales of governance, including governments and non-state actors, along with substantive financing.

What needs to happen in the transport sector to cut CO2?
Without mitigation actions, transport emissions could grow by 65% by 2050 – largely driven by rising demand for freight and passenger services in developing countries in Africa and Asia. However, successful mitigation strategies could reduce sectoral emissions by 68%.
- Demand-side solutions: The systemic infrastructure changes enable behavioural modifications and reductions in demand for transport services that can in turn reduce energy demand.
- The response to the Covid-19 pandemic has also shown that behavioural interventions can reduce transport-related GHG emissions. For example, Covid-19-based lockdowns have confirmed the transformative value of telecommuting replacing significant numbers of work and personal journeys as well as promoting local active transport.
- Urban designing: Urban transport is responsible for around 8% of global CO2 emissions. Urban designs influence greenhouse gas emissions in a major way.
- For example, research shows that implementing “urban form changes” – such as making cities denser to reduce the travel demand – could cut urban transport emissions by one quarter by 2050, compared with a business-as-usual scenario.
- Electromobility: It means the use of electrically powered vehicles, such as cars, bikes, and buses. It is the biggest change in transport since AR5.
- The report also emphasized that battery-electric vehicles (BEVs) have lower life-cycle greenhouse gas emissions than internal combustion engine vehicles (ICEVs) when they are charged with low carbon electricity.
- Also, EVs would save money relative to combustion-engine vehicles, with a mitigation cost of less than $0 per tonne of CO2 saved.
- They also have other benefits, such as their potential to support the grid. As per the report, “electric vehicles offer the greatest low-carbon potential for land-based transport.”

- Hydrogen fuel cells vehicles (HFCVs): One alternative to BEVs are hydrogen fuel cells vehicles (HFCVs). Energy consumption of HFCVs is very low compared to internal combustion engine vehicles (ICEVs) and battery electric vehicles (BEVs).
- Both electric vehicles and hydrogen fuel cell vehicles require separate charging infrastructure, so there needs to be simultaneous investment in both infrastructure and vehicle technologies for both to decarbonize rapidly.
- However, the feasibility of HFCVs is lower than that of BEVs – in part because the infrastructure to produce, transport and deliver hydrogen is under-developed.
- Use of biofuels: Biofuels could be used in all segments of the transport sector. The report added that sustainable biofuels can offer additional mitigation benefits. However, there are concerns about the feasibility of biofuels, including the land, water, and biodiversity impacts.
- Decarbonizing the aviation and shipping industries: Despite growing interest in the use of biofuels for aviation, demand and production volumes remain negligible compared to conventional fossil aviation fuels. Further R&D are still needed to decarbonize the shipping and aviation industries.
- Hydrogen holds significant promise for emissions reductions in harder-to-electrify transport segments, such as heavy-duty vehicles, shipping and aviation.
- Electrification could play a niche role for aviation and shipping for short trips. E.g., for shorter ranges, flights of light planes carrying up to 50 passengers may be able to use electric power.
- The report also suggests inclusion of emissions from international shipping and aviation in the Paris Agreement.

How can industry be decarbonized?
- Getting to net-zero industrial CO2 emissions is possible but challenging. The different drivers in the transition of industry to net-zero emissions includes electrification, improving energy and material efficiency and carbon capture and utilization (CCU) etc.
- All these options would require scaling up infrastructure – from electrification to hydrogen and recycling – but they also require the phase-out or conversion of existing industrial plants.
- Implications of geographical distribution of renewable resources for Industrial sector: The geographical distribution of renewable resources has implications for industry, including “reshaping” where energy production and material manufacturing takes place, how value chains are organized, trade patterns and what gets shipped across the world.
- Countries with abundant solar and wind “or low fugitive methane co-located with Carbon capture and storage (CCS) geology” could become exporters of hydrogen or its carriers or become the epicentre of basic material production. This reallocation will have global distributional effects on employment and economic structure.

- Circular economy for industry: Circular economy for industry involves moving away from an “extract-produce-use-discard” model of production to the design of durable, easily repaired goods, with components that can be reused, remanufactured, and recycled. This, in turn, can reduce emissions from energy and the processing of raw materials.
- For instance, switching to recycled materials to produce aluminium requires only about 5% as much energy as primary production.
- The report describes how circular economies can operate at different levels, from what it describes as the micro level of cleaner production within an individual company, to “meso-level” shared use of resources between firms practicing “industrial symbiosis” and, finally, “urban symbiosis”, where industries look to cities themselves as sources of waste and raw materials, or cooperate to form a “regionally eco-industrial network”.
Way forward: The report says with medium confidence that even emissions-intensive industries, such as steel, plastics, ammonia, and cement, can achieve close to net-zero emissions by 2050 if they deploy multiple available and emerging options. This will require a shift from the historic focus on important but incremental improvements, such as energy efficiency, to transformational changes in energy use and raw material sourcing.
Where can we use
P1- Environmental Geography
P2- Contemporary Issues
GS-P1 and P3
Source:
- IPCC PRESS RELEASE The evidence is clear: the time for action is now. We can halve emissions by 2030
- What comes after the IPCC’s sixth assessment report?
- IPCC report: urgent climate action needed to halve emissions by 2030
- Working Group III Mitigation of Climate Change
- Explained | What are the takeaways from the latest IPCC report on climate change?
- Why are the three IPCC working group reports significant?
- In-depth Q&A: The IPCC’s sixth assessment on how to tackle climate change
Case Study on Mobility in Kolkata
Problem Statement
There is a need to curb the emissions from transportation sector.
The Actions taken
- Urban mobility transitions in Kolkata shows interconnected policy, institutional and sociocultural drivers for socio-technical change. Change has unfolded in complex interactions between multiple actors, sustainability values and megatrends, where direct causalities are hard to identify.
- As many as twelve different modes of public transportation, each with its own system structure, actors and meanings co-exist and offers means of mobility to its 14 million citizens.
- Most of the public transport modes are shared mobility options ranging from sharing between two people in a rickshaw or between a few hundred in metro or sub urban trains.
- Sharing also happens informally as daily commuters avail shared taxis and neighbours borrow each other’s car or bicycle for urgent or day trips.
- However, the prominence of policy actors as change-agents is clear as they are changing multiple regimes from within.
- The state government initiated infrastructural change in public bus systems, coordinated with private and non-governmental actors such as auto-rickshaw operators, app-cab owners who hold crucial agency in offering public transport services in the city. The latter can directly be attributed to the global momentum of mobility-as-a-service platforms, at the intersection of digitalisation and sharing economy trends.
- These measures contributed positively in bringing down the trend of greenhouse gas emissions per unit of GDP to half in one decade within the Kolkata metropolitan area, with potential for further reduction.
- More thoughtful action at a policy level is required to sustain and coordinate the diversity of public transport modes through infrastructure design and reflecting on the overall directionality of change.

Sources:
Share the article
Get Latest Updates on Offers, Event dates, and free Mentorship sessions.

Get in touch with our Expert Academic Counsellors 👋
FAQs
Geography Current Affairs focuses on the contemporary issues, events, and developments in the field of geography. It covers recent geographical phenomena, environmental changes, geopolitical shifts, and related news. This differs from regular geography studies which may focus more on foundational concepts, historical contexts, and theoretical frameworks.
Updates are provided regularly to ensure that subscribers stay informed about the latest developments in geography. Typically, updates are provided on a fortnightly basis, depending on the frequency of significant events and changes in the field.
Absolutely. Geography Current Affairs serves as a valuable resource not only for Geography optional but also for GS papers, especially GS Paper 1 (covering Indian Heritage and Culture, History, and Geography of the World and Society) and GS Paper 3 (covering Technology, Economic Development, Biodiversity, Environment, Security, and Disaster Management). It aids in building a holistic understanding of various topics and strengthens answer-writing skills by incorporating contemporary examples and perspectives.
Geography Current Affairs holds immense importance for UPSC preparation, particularly for aspirants opting for Geography optional. It helps candidates stay updated with the latest developments, geographical phenomena, environmental issues, and geopolitical shifts worldwide, aligning them with the dynamic nature of the subject as tested in the UPSC examinations.