
10 Oct to 24 Oct, 2026
STUBBLE BURNING IN INDIA
Why in news: The forecasts come as Delhi recorded its first 'poor' air quality day of the season on 20th October , with the Air Quality Index settling at 245, the highest in 100 days.
About:
Stubble burning persists not because farmers are careless, but because burning remains the cheapest and fastest option inside a cropping system that policy itself created. It is the practice of setting fire to paddy straw left after harvest, mainly between late September and early November, to clear fields for wheat sowing .
Scale of the problem
- Straw volume: Punjab has about 31.76 lakh hectares under paddy and generates nearly 20 million tonnes of straw a year .
- Historic fire counts: Punjab recorded 76,590 farm fires in 2020 and 71,304 in 2021, before a steady fall in official counts.
The 2026 season so far
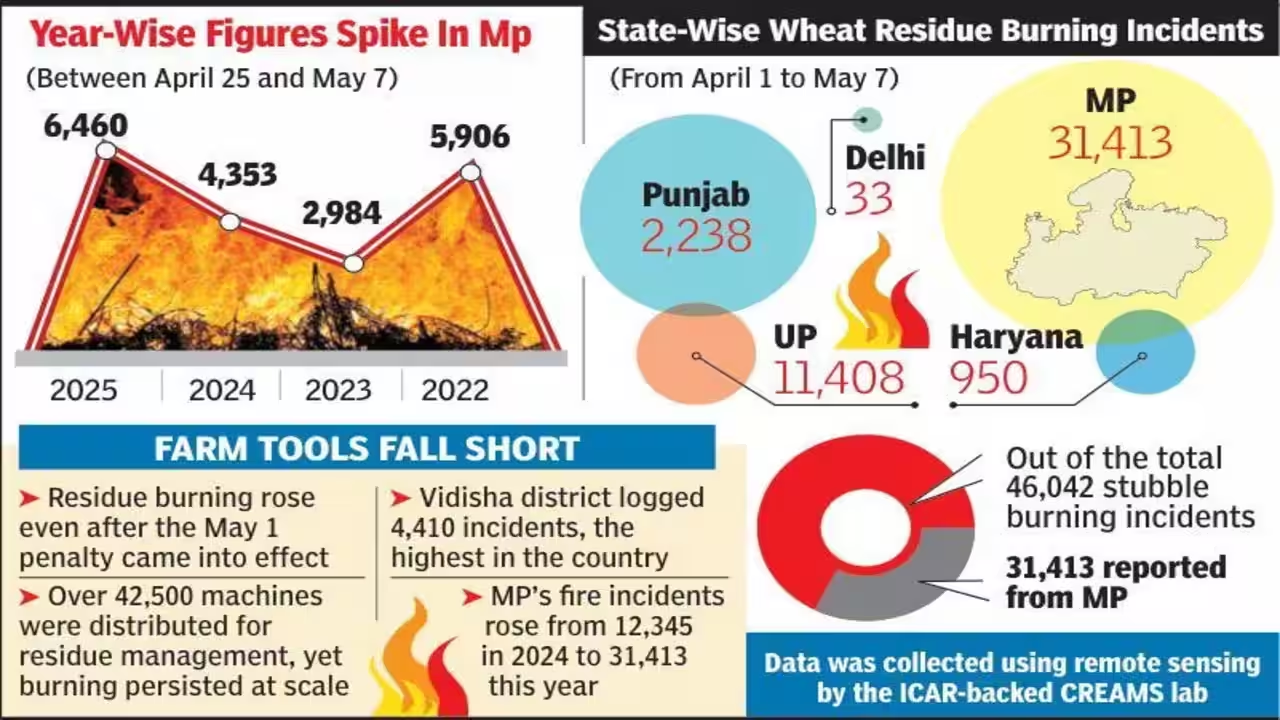
- Fires are spreading beyond Punjab: by early October 2026, 254 cases were logged across seven states, and Madhya Pradesh (94) had overtaken Punjab (84).
- Official counts keep falling: for the comparable 2025 period, Punjab had 97 cases and Haryana 7, against 84 and 4 this year.
Why the issue is back in focus: the Supreme Court has directed Punjab, Haryana and Uttar Pradesh to fill State Pollution Control Board vacancies within three months and urged the Centre to consider penal measures . The central question is no longer whether farmers burn, but why they still find it rational.
Economic drivers
For a farmer, a matchstick costs nothing, while every alternative costs money, labour or time.
1. Assured MSP and procurement lock in paddy
- The MSP and procurement system mainly favours wheat and rice, so farmers stay in the paddy–wheat cycle that produces the straw in the first place.
- Example: alternatives like maize or pulses lack equally assured procurement, so diversification remains risky for the farmer.
2. Burning is the cheapest disposal method
- Balers, shredders or in-field incorporation need investment, fuel and labour; burning needs none.
- Small and marginal farmers, who cannot buy machines, feel this cost gap the most.
3. The wheat-sowing window is very short
- The gap between paddy harvest and wheat sowing is only a few weeks, and late wheat sowing lowers yield.
- Example: in peak harvest weeks, many farmers compete for the same rented machines, so waiting means losing days.
4. Weak market value of straw
- Paddy straw has high silica, which makes it poor fodder and hard on machinery used as feedstock.
- Industry demand exists, but aggregation, transport, storage and assured offtake remain unresolved .
5. Incentives are small compared with costs
- Haryana pays ₹1,000 per acre to farmers who avoid burning..
- Penalties also stay low: in one Punjab season, environmental compensation of only ₹13.25 lakh was imposed across 246 cases.
Technological drivers
Mechanisation solved the labour problem of harvesting but created the residue problem, and the fix has not caught up.
1. Combine harvesters leave tall stubble
- Standard combines leave 10–15 cm of stubble that is hard to manage without special equipment.
- Before the 1960s, crops in Punjab and Haryana were cleared by hand; mechanical harvesters later left a layer of residue behind.
2. Machines exist, but use is uneven
- About 1.48 lakh crop residue management (CRM) machines have been distributed in Punjab since 2018-19.
- Yet Custom Hiring Centres often lack enough machines, and farmers face logistical hurdles in booking them at peak time.
- Example: one year, against a target of 36,020 machines, Punjab sanctioned 14,596 and farmers procured only 6,597 before harvest.
3. Ex-situ supply chain is still thin
- Using straw in boilers, pellets, CBG and power needs collection, baling, storage and transport, which remain weak links.
- Progress is real: Punjab's ex-situ use rose from 0.92 million tonnes in 2020-21 to an estimated 7.06 million tonnes in 2025, and pellet plants grew from 18 to 37.
4. Monitoring technology is being outwitted
- India's fire counts rely largely on NASA satellites that pass over around 1:30–2 pm; geostationary data show many fires now lit later in the afternoon.
- An iFOREST report found over 90% of large farm fires in Punjab now occur after 3 pm, compared with 3% in 2021.
- So falling official counts may partly reflect changed timing, not only less burning.
Policy and institutional drivers
Several well-meant policies pull in opposite directions, and enforcement is weak where it matters.
1. Groundwater law shifted the calendar
- Punjab's Preservation of Subsoil Water Act, 2009 delays paddy transplanting to save groundwater, which pushes harvest later into October–November.
- The result: less time before wheat sowing, so "farmers burn more and later," just as winter weather traps smoke.
- Example: a water-saving policy unintentionally worsened an air-pollution problem — a classic case of policy silos.
2. Penalties over incentives
- Current policies often stress penalties over rewards, which discourages eco-friendly adoption.
- Unclear definitions of stubble burning and environmental compensation, and confusing "Red Entry" markings in land records, add to farmer distrust.
3. Weak and nominal enforcement
- The Supreme Court pulled up Punjab and Haryana for collecting only nominal fines, and said clean air is a fundamental right.
- It also criticised the Commission for Air Quality Management (CAQM) for holding meetings without penal action; only five of its 11 members attended one meeting.
4. Institutional capacity gaps
- State Pollution Control Boards have long-standing vacancies, which the Supreme Court has now ordered filled within three months.
- Funding frameworks such as the environmental compensation fund remain weakly used.
5. Political sensitivity and federal friction
- Farmers are a powerful vote bank in Punjab and Haryana, so strict action is politically costly.
- Delhi suffers the smoke but has no control over farm policy in neighbouring states, leading to a yearly blame game.
Impacts
The damage goes well beyond Delhi's skyline: it hits rural lungs, farm soils and the national economy.
1. Air quality: an episodic but sharp contributor
- Burning releases PM10, PM2.5, NOx, methane, carbon monoxide and volatile organic compounds that form smog.
- Government data: stubble burning averaged 10.6% of Delhi's PM2.5 between 8 October and 7 December one season, peaking at 35%.
- On peak days, a NASA scientist estimates the share can reach 40–70%.
2. The contribution debate: not the only villain
- A Japanese-led study found stubble burning contributed about 14% of Delhi-NCR's PM2.5 in October–November 2022.
- Delhi's PM2.5 stayed fairly stable even as satellite-detected fires fell by at least 50% between 2015 and 2023, pointing to traffic, construction and other local sources.
- Takeaway: farm fires turn bad air into severe air for a few weeks; local sources keep it bad all winter.
3. Health: rural people are the first victims
- An IFPRI study found living in districts with intense crop burning triples the risk of acute respiratory infection, especially for children under five..
- Smog raises the risk of asthma, COPD, bronchitis and lung cancer .
4. Economy: a heavy hidden bill
- The same IFPRI study put the cost of exposure to crop-burning pollution at about $30 billion (nearly ₹2 lakh crore) a year for Punjab, Haryana and Delhi .
- Over five years, losses from crop burning and firecrackers were estimated at $190 billion, about 1.7% of GDP.
5. Soil and climate: farmers burn their own capital
- Fire destroys soil nutrients, dries out the topsoil and kills useful microbes .
- ICAR estimates that managing 23 million tonnes of rice residue properly could save about 1.4 lakh tonnes of nitrogen a year, worth about ₹200 crore .
- Burning also adds greenhouse gases, worsening global warming.
Measures taken so far and their gaps
India has built a wide toolkit; the gap lies in reach, timing and economics, not in ideas.
|
Measure |
What it does |
Key gap |
|
CAQM framework |
In-situ management, ex-situ use, ban and environmental compensation. |
Supreme Court found weak penal follow-up |
|
CRM machinery subsidy (SMAM) |
Subsidised Happy Seeder, Super Seeder, mulchers, balers; 1.48 lakh machines in Punjab since 2018-19 |
Peak-season shortage; small farmers depend on CHCs |
|
CHC network |
Over 24,700 CHCs in Punjab and about 6,800 in Haryana support machine hiring |
Booking delays and uneven coverage |
|
Pusa bio-decomposer |
Microbial spray that turns stubble into compost in about 25 days |
Too slow for a tight sowing window |
|
Thermal co-firing |
About 2 million tonnes of straw to be co-fired in 11 NCR thermal plants |
Small share of total straw |
|
Supply-chain guidelines |
Pilot projects with aggregators and industry; 333 biomass depots planned across four states. |
Aims to collect only 1.5 million tonnes over three years |
|
Cash incentives |
Haryana pays ₹1,000 per acre for not burning |
Below the real cost of management |
|
Enforcement |
Fines, FIRs, "Red Entry" in land records; 147 FIRs in one Punjab season. |
Nominal fines; farmer resentment |
|
Local innovations |
Chhattisgarh's Gauthans turn stubble into manure; Punjab's i-Khet app helps book machines |
Not yet scaled to Punjab–Haryana volumes |
Net result: Punjab's in-situ management rose from 6.45 million tonnes in 2020-21 to about 11.4 million tonnes in 2025. That is real progress, but a large share of straw still has no assured, profitable outlet.
Way forward
The goal should be to make not burning more profitable than burning, while enforcing the rules fairly.
1. Fix the economics
- Price for straw: a parliamentary committee has proposed an MSP-like price for paddy residue; annual benchmark prices should cover collection and labour costs.
- Crop diversification: assured procurement for maize, pulses and millets, so fewer farmers are locked into paddy.
- Realistic incentives: link per-acre support to actual management cost, paid quickly through direct benefit transfer.
2. Build a working straw economy
- Assured offtake: long-term contracts between FPOs or aggregators and boilers, pellet, CBG and 2G ethanol plants.
- Storage and logistics: village-level depots and baler networks, mapped with real-time crop maturity data.
- Value-added uses: biochar, packaging and cardboard, which also support carbon markets.
3. Smarter farm technology
- Short-duration paddy varieties: they widen the window before wheat sowing.
- Machines where they are needed: Super SMS attachments on every combine, and more CHC capacity at panchayat level.
- Staggered harvesting: plan harvest dates so machines are not all needed in the same week.
4. Better policy and institutions
- Policy coherence: align groundwater, procurement and air-quality policies instead of letting them clash.
- Empowered CAQM and SPCBs: fill vacancies, ensure full attendance and fund enforcement staff.
- Fair, graded enforcement: penalties for repeat large-scale burners, support for small farmers.
5. Honest monitoring
- Round-the-clock tracking: use geostationary satellite data and Indian sensors, not just the 1:30 pm overpass, so counts reflect reality.
- Measure contribution, not just fires: publish daily source-apportionment data so policy targets the real share.
6. Farmers as partners
- Awareness and training: show farmers that straw adds nutrients and saves fertiliser costs.
- Employment link: an MGNREGA-type programme for collecting and composting stubble
7. Tackle Delhi's local sources too
- Transport, construction dust and local biomass burning keep air bad all winter; fixing farm fires alone will not give Delhi clean air.
Conclusion
Stubble burning is a symptom of a deeper problem: a paddy–wheat system shaped by MSP, groundwater rules and mechanisation, where burning is the farmer's most rational choice. Official fire counts have fallen sharply, but late-afternoon burning and spreading fires in states like Madhya Pradesh show the problem has shifted, not vanished.
Lasting change needs a shift from blame to partnership: pay for straw, build a real biomass economy, diversify crops and enforce rules fairly. As the Supreme Court has said, clean air is a fundamental right — and securing it for Delhi must not come at the cost of the farmer's livelihood.
Where to use:
Paper III ( General Studies ): Agriculture and issues, Environment and pollution
CYCLONE WARNING SYSTEMS IN INDIA
Why in news: The India Meteorological Department (IMD) launched the interactive WebGIS-based Cyclone Warning and Marine Weather Services Decision Support System (DSS)
About:
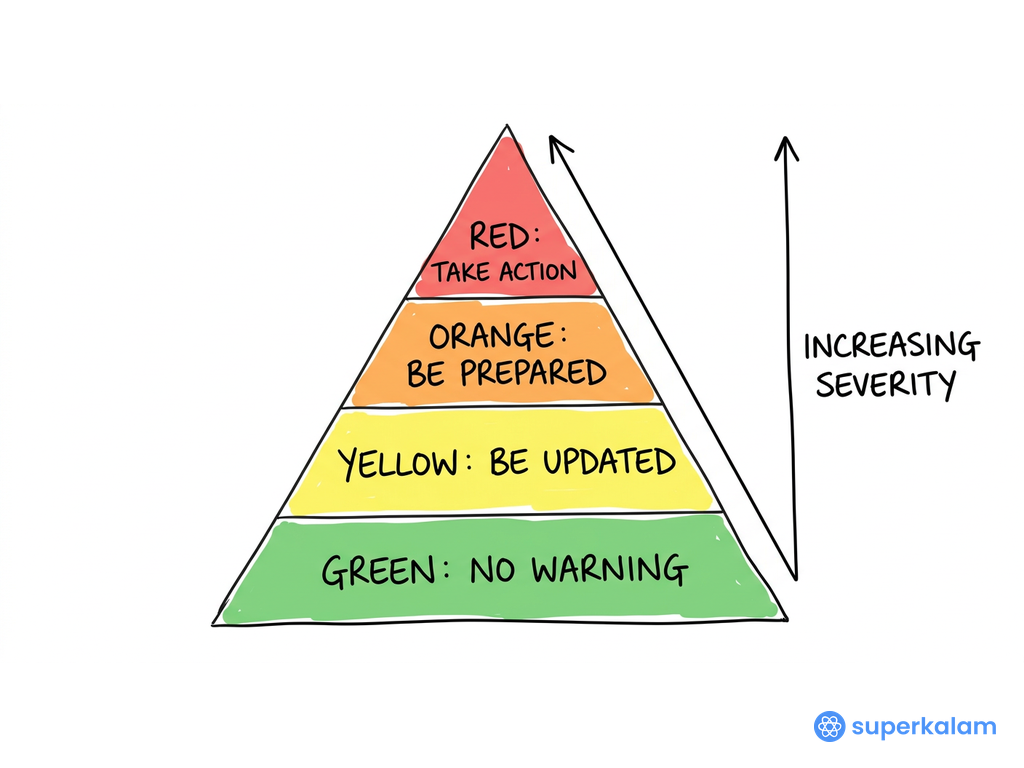
IMD's new Decision Support System (DSS) marks a shift in India's cyclone warning from issuing forecasts to helping people act on them. On 12 October 2026, the India Meteorological Department dedicated to the nation an interactive, WebGIS-based Cyclone Warning and Marine Weather Services DSS
Key features of the DSS
The platform puts every major cyclone hazard on one interactive map instead of scattered bulletins.
What makes it different
- WebGIS base: hazards are shown as layers on digital maps, so a user can zoom into a district or village.
- Multi-hazard view: a cyclone brings wind, rain, flooding and surge together; the DSS shows each separately but on one screen.
- Open access: available to the public through IMD and RSMC websites, not just to officials..
- Marine services: covers forecasts for shipping, fisheries, ports and offshore activity, not only landfall.
Why India needs it
India's geography, population density and a warming ocean together make cyclones a recurring national risk.
1. A long and exposed coastline
- India's coastline was re-measured at 11,098 km in 2023–24, up from the earlier 7,516 km figure ..
- Of the older 7,500 km estimate, about 5,700 km is highly exposed to severe cyclones .
2. Dense coastal population
- About 40% of India's population lives within 100 km of the coast, and roughly 32 crore people are vulnerable to cyclone hazards.
- 13 states and Union Territories have been identified as cyclone-prone under the National Cyclone Risk Mitigation Project .
3. Storm surge: the biggest killer
- Shallow coastal seabed and tidal patterns make the Indian coast especially prone to storm surge .
- Example: the 1999 Odisha Super Cyclone killed over 10,000 people.
4. A warming Arabian Sea is changing the risk map
- An IITM-led study found a 52% rise in cyclone frequency over the Arabian Sea, 80% longer duration and a tripling of accumulated cyclone energy..
- Very severe cyclones there have risen by about 150%..
- Example: Cyclone Biparjoy (2023) became the longest-lasting Arabian Sea cyclone on record, over 10 days.
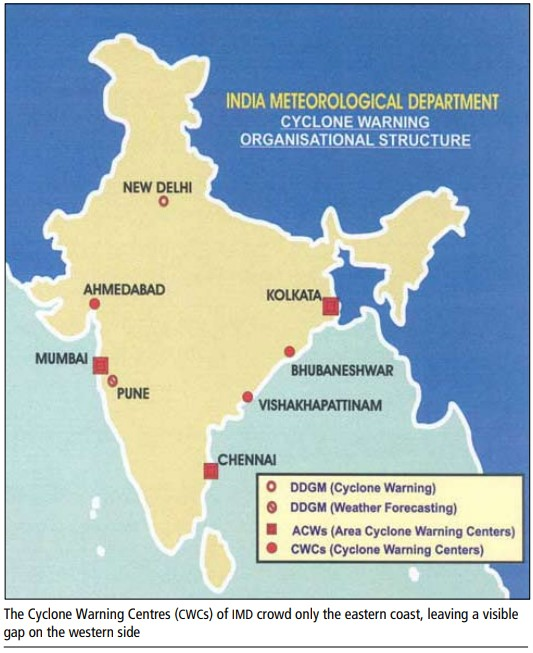
- Implication: the west coast, once seen as safer, now needs the same preparedness as the east.
Significance across dimensions
The DSS is a disaster tool, but its value reaches livelihoods, the economy, science and diplomacy.
1. Disaster management: from response to preparedness
- Location-specific action: officials can see which villages face surge or flooding, so evacuation can be precise rather than blanket..
- Sendai alignment: it was launched a day before the International Day for Disaster Risk Reduction, which is linked to the Sendai Framework 2015–2030 ..
2. Economic: cheaper and smarter evacuations
- Better warnings have shrunk evacuation zones by about 300 km and cut evacuation costs by 60% over two decades, according to IMD's chief.
- A map-based view can narrow zones further, saving money and reducing disruption.
3. Livelihoods: fishers and coastal communities
- Marine forecasts help fishers decide when not to go to sea, protecting both lives and boats.
- Example: during Cyclone Biparjoy (2023), the Kutch coast's Jakhau fisheries port lay in the impact zone.
4. Blue economy: ports and shipping
- Ports such as Kandla and Mundra sit on cyclone-exposed coasts; wind and surge layers help plan ship movement and cargo shutdowns.
- Safe shipping supports India's maritime trade and Sagarmala-led port growth.
5. Inland risk: floods after landfall
- River-catchment rainfall forecasts address a blind spot: cyclones often cause floods far inland.
- Example: after Biparjoy, Rajasthan's Jalore, Sirohi and Barmer districts faced flood-like conditions.
6. Governance and coordination
- One shared map gives NDMA, states, armed forces and the Central Water Commission the same picture, reducing confusion between agencies .
7. Science, technology and transparency
- The DSS builds on large gains in forecasting: IMD's track forecast errors fell from 97, 145 and 183 km (2011–15) to 77, 117 and 159 km (2016–20) for 24, 48 and 72 hours .
- Public access builds trust and reduces reliance on rumours during emergencies.
8. Regional leadership
- IMD runs the Regional Specialised Meteorological Centre (RSMC) New Delhi, which issues cyclone advisories for the north Indian Ocean region; the DSS is hosted on RSMC websites too..
- This strengthens India's role as a first responder and a provider of public goods for neighbours.
How India's cyclone warning has evolved
In under three decades, India moved from catastrophic loss of life to near "zero casualty" cyclone management; the DSS is the next step in that journey.
|
Year |
Milestone |
Lesson |
|
2026 |
WebGIS Cyclone Warning and Marine Weather DSS launched |
Focus shifts to impact-based, map-led warnings |
|
2023 |
Cyclone Biparjoy: over 1.08 lakh people evacuated in Gujarat within three days; officials reported zero cyclone deaths. |
Accurate warning plus local action saves lives |
|
2014 |
Cyclone Hudhud accurately forecast, landfall 12 October . |
Forecast skill becomes consistent |
|
2013 |
Cyclone Phailin accurately forecast, landfall 12 October |
India earns international recognition |
|
2010 |
National Cyclone Risk Mitigation Project begins with World Bank support . |
Shelters, embankments and warning networks built |
|
2008 |
IMD starts biannual pre-cyclone exercises |
Agencies plan together before the season |
|
2003 |
IMD introduces objective 24-hour track forecasts |
Science-based forecasting begins |
|
1999 |
Odisha Super Cyclone kills over 10,000 people |
The wake-up call |
Forecast accuracy behind the success
- The 24-hour landfall point error fell from 157.5 km to 66.5 km between 2003 and 2013 .
- When Dr Mohapatra joined in 2007, IMD's accuracy lagged the US National Hurricane Centre by about 50% and forecasts covered only 24 hours : track forecasts now extend to 120 hours .
Challenges and limitations
A better map does not by itself guarantee better decisions; science, access and local capacity still limit outcomes.
1. Intensity forecasting still lags track forecasting
- IMD's own assessment notes that cyclone intensity errors over the north Indian Ocean remain larger than in other basins, even as track errors have fallen.
- Rapid intensification in a warm Arabian Sea can turn a weak storm severe within a day, leaving little time to act.
2. Data gaps from inside the storm
- Large track and intensity errors stem partly from a lack of observations from the cyclone's core .
- Unlike the US, India has no routine aircraft reconnaissance of cyclones.
3. Communicating uncertainty
- A cyclone's forecast track and its zone of damaging weather are different things .
- If users read the track line as the only danger area, people just outside it may wrongly feel safe.
4. Digital divide and the last mile
- A WebGIS portal needs internet, a device and map literacy; fishers at sea and elderly coastal residents may have none of these.
- So the platform must work alongside SMS, radio, loudspeakers and local volunteers, not replace them.
5. Local institutional capacity
- The DSS gives information, but action depends on district disaster authorities, shelters and transport.
- Capacity varies widely between states; Odisha and Gujarat are seen as strong, while others lag.
6. Inland and compound hazards
- Cyclones now trigger urban flooding and river floods far from the coast, where preparedness is weaker.
- Example: Biparjoy's rains flooded parts of Rajasthan after landfall in Gujarat
7. Technical reliability
- Heavy traffic during a storm and possible power or network failures can make a web platform unavailable exactly when it is most needed.
Way forward
The DSS should grow from a forecast map into a full impact-based warning system that reaches every coastal household.
1. Move to impact-based forecasting
- Show impact, not just weather: overlay housing, roads, shelters and hospitals so officials see what will be damaged, not only how strong the wind will be.
- Risk atlases: integrate NCRMP hazard and vulnerability maps of the 13 cyclone-prone states and UTs.
2. Strengthen the science
- Better observations: more ocean buoys, Doppler radars along both coasts and, over time, aircraft reconnaissance of the cyclone core.
- Rapid-intensification research: focus on the warming Arabian Sea, where the risk is rising fastest.
- AI and high-resolution models: use machine learning alongside numerical models to sharpen intensity forecasts.
3. Close the last mile
- Multilingual, simple outputs: short alerts in local languages, with icons for people who cannot read maps.
- Many channels: push DSS alerts through cell broadcast, SMS, community radio, apps for fishers and village loudspeakers.
- Offline backup: low-bandwidth versions and mirrored servers so the platform survives traffic surges.
4. Build local capacity
- Train district officials: regular drills using the DSS, building on IMD's 2008-era pre-cyclone exercise model.
- Community volunteers: train Aapda Mitras and fisher leaders to read and pass on warnings.
- Learn from best practice: spread the Odisha and Gujarat "zero casualty" approach to weaker states.
5. Cover inland and compound risk
- Link with flood systems: connect catchment-rainfall forecasts to Central Water Commission flood warnings and urban drainage plans.
- Climate-proof planning: use DSS data in coastal zoning, mangrove restoration and resilient infrastructure.
6. Share regionally
- Extend to neighbours: offer the platform's outputs to Bangladesh, Sri Lanka, Myanmar and island states, supporting India's role as a regional first responder.
Conclusion
The WebGIS Cyclone Warning and Marine Weather DSS reflects how far India has come since the 1999 Odisha Super Cyclone: from a country that counted its dead in thousands to one that now aims for zero casualties. By bringing tracks, winds, rainfall, storm surge and river-basin forecasts onto one interactive map, it turns forecasts into decisions.
Yet its real test lies at the last mile — a fisher at sea, an elderly villager in a low-lying hamlet, a district officer with hours to act. As warming seas make cyclones stronger, especially in the Arabian Sea, India must pair this digital leap with better science, stronger local institutions and people-centred communication. Only then will an early warning truly become early action.
Source : https://www.pib.gov.in/PressReleasePage.aspx?PRID=2322562®=48&lang=1
Where to use:
Paper I ( General studies ) : Cyclone and their management
INLAND WATERWAYS - 24 October 2026
Why in news : India has intensified efforts to develop its inland waterways as a cost-effective, environmentally sustainable and efficient mode of freight transport, strengthening multimodal connectivity and reducing dependence on road and rail networks.
About:
Rivers were India's first highways, from Pataliputra's Ganga trade to the colonial steamer routes of Bengal. After decades of neglect, they are returning as freight corridors. Cargo on National Waterways rose from 29 million tonnes (MT) in 2014–15 to 218 MT in 2025–26, already exceeding the Maritime India Vision 2030 target of 200 MT. Yet inland waterways still carry only about 2% of freight, against roughly 47% in China and 40% in Europe.The gap is best explained geographically.
Why rivers decide navigability
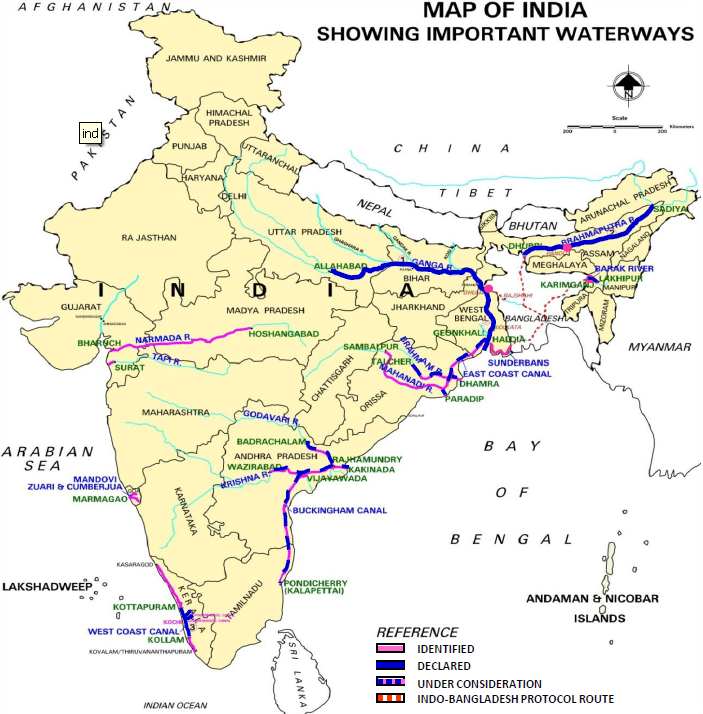
- River regime: Snow-fed Himalayan rivers such as the Ganga (NW-1) and Brahmaputra (NW-2) are perennial, while rain-fed peninsular rivers shrink sharply in the dry season. Navigation therefore concentrates in the northern plains and the Northeast.
- Gradient and channel form: The Ganga's gentle gradient across the alluvial plain suits barges, but its meanders and shifting sandbars reduce the least available depth. The braided Brahmaputra changes channels every season, so routes must be re-surveyed often.
- Sediment load: Himalayan rivers carry very heavy silt, which demands constant dredging.
- Navigability norms: A national waterway ideally needs a 45 m-wide channel, at least 1.5 m depth and a continuous 50 km stretch .
- Coastal landforms: Lagoons and estuaries offer calm, tide-assisted routes. Examples are Kerala's backwaters on the West Coast Canal (NW-3) and Goa's Mandovi–Zuari estuaries, long used by iron-ore barges.
Economic geography Of Inland Waterways
- Weber's least-cost location: Weber held that industries locate to minimise transport costs, especially for bulky, weight-losing raw materials. Waterways cost about ₹0.25–0.30 per tonne-km, against about ₹1 by rail and ₹1.5 by road . It fits that coal, iron ore, sand and fly ash make up over 68% of waterway cargo .
- Tapering freight rates (Hoover): Water transport has high terminal costs but very low line-haul costs, so it gains only over long distances. This explains why IWT suits long Haldia–Varanasi hauls but loses to trucks on short routes.
- Ullman's spatial interaction: Flows need complementarity, transferability and few intervening opportunities. The Indo-Bangladesh Protocol routes raise transferability between the Northeast and Kolkata, bypassing the narrow Siliguri Corridor.
- Taaffe–Morrill–Gould model: Transport networks grow inland from ports along "penetration lines," with feeders and interconnections added later. NW-1 from Haldia is such a line, and multimodal terminals at Varanasi, Sahibganj and Haldia are the interconnection stage.
- Efficiency and externalities: IWT moves about 105 tonne-km per litre of fuel, against 85 by rail and 24 by road, and emits 32–36 g CO₂ per tonne-km compared with 51–91 g by road.
Regional geography linkages
- Riverine settlements: Dense populations line the Ganga–Brahmaputra plains, so waterways serve people as well as cargo. Passenger trips on National Waterways rose to 10.56 crore in 2025–26, with ferries on 23 waterways .
- Growth poles (Perroux) and cumulative causation (Myrdal): Terminals at Varanasi and Sahibganj can act as growth poles. If they draw warehousing and industry, they start a cycle of local growth in lagging Bihar, eastern UP and Jharkhand.
- Core–periphery (Friedmann): The Northeast is a classic periphery. Operational waterways on the Brahmaputra, Barak, Dhansiri and Kopili (NW-57) now link it to the core..
- Land and livelihoods: Waterways need little land acquisition and support fishers, boat-builders and river tourism under the "Arth Ganga" approach.
Constraints, Way forward and conclusion
Constraints
- Underused network: only 32 of 111 National Waterways are operational .
- Seasonal depth and siltation: lean-season depth falls and dredging costs stay high.
- Ecological risk: dredging threatens habitats such as the Vikramshila Gangetic Dolphin Sanctuary on NW-1.
- Weak first- and last-mile links: missing connections push shippers back to road and rail.
Way forward
- Plan by river basin: integrate river regime, sediment and ecology instead of planning stretch by stretch.
- Use incentives: the Jalvahak scheme reimburses 35% of operating costs on NW-1, NW-2 and NW-16 to encourage a shift to waterways.
- Connect the modes: link terminals with Dedicated Freight Corridors under PM Gati Shakti.
- Go green and digital: adopt low-draft, LNG or electric vessels and River Information Systems.
Conclusion: India's waterways show how physical geography sets the limits while economic geography sets the potential. If river regimes are respected and terminals become growth poles, IWT can cut logistics costs, decarbonise freight and integrate peripheral regions such as the Northeast.
Source:
https://www.pib.gov.in/PressReleasePage.aspx?PRID=2255798®=3&lang=2
Where to use:
Paper II ( Geography optional ): Trade and Transport
TAMIL NADU ANOMALY
TAMIL NADU ANOMALY: Unlike most of India, Tamil Nadu receives its main rainfall in October–December from the Northeast (retreating) monsoon, not in June–September. About 48% of the state's annual rain, and up to 60% along the coast, falls in this season. During the Southwest monsoon, Tamil Nadu lies in the rain shadow of the Western Ghats, and the Bay of Bengal branch blows parallel to its coast. In winter, northeast winds pick up moisture over the Bay of Bengal and strike the Coromandel coast directly. Depressions and cyclones add more rain. El Niño years often bring above-normal Northeast monsoon rain to Tamil Nadu.
OCEANIC NIÑO INDEX (ONI)
OCEANIC NIÑO INDEX (ONI): The ONI is a three-month running average of sea surface temperature anomalies in the Niño 3.4 region (5°N–5°S, 120°–170°W) of the central Pacific. Values of +0.5°C or more indicate El Niño, and -0.5°C or less indicate La Niña. Since 1 February 2026, NOAA has officially replaced it with the Relative ONI (RONI), which measures Niño 3.4 temperatures relative to the average of the whole tropical belt. This removes the global warming signal, which was making El Niños look stronger and La Niñas weaker. ENSO strongly influences India's monsoon, drought and cyclone patterns.
GREEN SHIPPING CORRIDOR
GREEN SHIPPING CORRIDOR: A green shipping corridor is a specific maritime route between two or more ports where zero- or near-zero-emission ships, fuels and port infrastructure are tested and scaled up together. The idea was launched through the Clydebank Declaration at COP26 (2021). Shipping produces about 3% of global greenhouse gas emissions, and the IMO aims for net-zero around 2050. Corridors link ports, shipping lines and fuel producers so clean fuels such as green hydrogen, ammonia and methanol become viable. India is developing green hydrogen hubs at Kandla (Deendayal) and Tuticorin (V.O. Chidambaranar) ports, and has agreed with Singapore to develop a Green and Digital Shipping Corridor.
ECOSYSTEM ENGINEERS
ECOSYSTEM ENGINEERS: Ecosystem engineers are species that create, modify or maintain habitats by physically changing their environment, shaping conditions for many other species. The concept was proposed by Jones, Lawton and Shachak in 1994. Autogenic engineers change the environment through their own bodies, such as corals building reefs or trees forming canopies. Allogenic engineers transform materials, such as beavers building dams. In India, elephants open forest clearings and disperse seeds, termites enrich grassland soils, and wild buffaloes create wallows that hold water for other species. Losing such species can collapse whole habitats, so their reintroduction (for example, wild buffaloes in Kanha) supports ecosystem restoration.
RAPID INTENSIFICATION
RAPID INTENSIFICATION: Rapid intensification (RI) is a sudden strengthening of a tropical cyclone, usually defined as an increase in maximum sustained wind speed of at least 30 knots (about 55 km/h) within 24 hours. It happens when sea surface temperatures exceed about 28°C, ocean heat content is high, vertical wind shear is low and the mid-atmosphere is moist. Marine heatwaves and a warming Arabian Sea are making RI more frequent. Examples include Cyclone Ockhi (2017) and Cyclone Tauktae (2021). RI is dangerous because it shortens warning lead time and can turn a weak storm into a severe one before evacuations are complete.
CHILD UNDERNUTRITION IN BIHAR
Bihar carries one of India's heaviest child undernutrition burdens. It has about 1.47 crore children under five, so even small percentages mean millions of affected children.
Scale of the problem (NFHS-5, 2019–21)
- Stunting: 42.9%, second only to Meghalaya (46.5%); India average 35.5%.
- Wasting: 22.9%, against 19.3% nationally.
- Underweight: 41.0%, against 32.1% nationally.
- All three are far above WHO's "public health concern" levels (stunting 20%, wasting 10%).
District hotspots
- Sitamarhi (54.2%) and Sheikhpura (53.6%) are among India's ten worst districts for stunting.
- Arwal has the country's worst wasting (36.8%) and underweight (52.9%) rates.
- Jehanabad (36.6%) and Sheohar (35.4%) are also among the worst for wasting.
Trend
- Stunting fell from 48.3% (NFHS-4, 2015–16) to 42.9%, only about 5 percentage points in five years.
- Poshan Tracker data (March 2026) show stunting at 40.6% and underweight at 19.2%.
- Caution: Tracker covers only Anganwadi-registered children, so it is not directly comparable with NFHS survey data.
Geographical linkages
- North Bihar's Kosi–Gandak floodplains face recurrent floods that destroy crops, contaminate water and spread infections.
- Repeated diarrhoea worsens wasting even when food is available.
- Dense rural population and small landholdings limit dietary diversity.
Interventions
- Mission Saksham Anganwadi and Poshan 2.0 provide supplementary nutrition.
- Poshan Tracker gives real-time growth monitoring.
- Bihar ranked first nationally in Poshan Pakhwada 2026.
Lessons
- State averages hide district extremes; Arwal and Sitamarhi need targeted, district-level action.
- Stunting declines slowly because it reflects long-term deprivation from pregnancy to age two (the "first 1,000 days").
- Nutrition needs multisectoral action: food, clean water, sanitation, flood resilience and women's education together.

Places in News - 24 October 2026
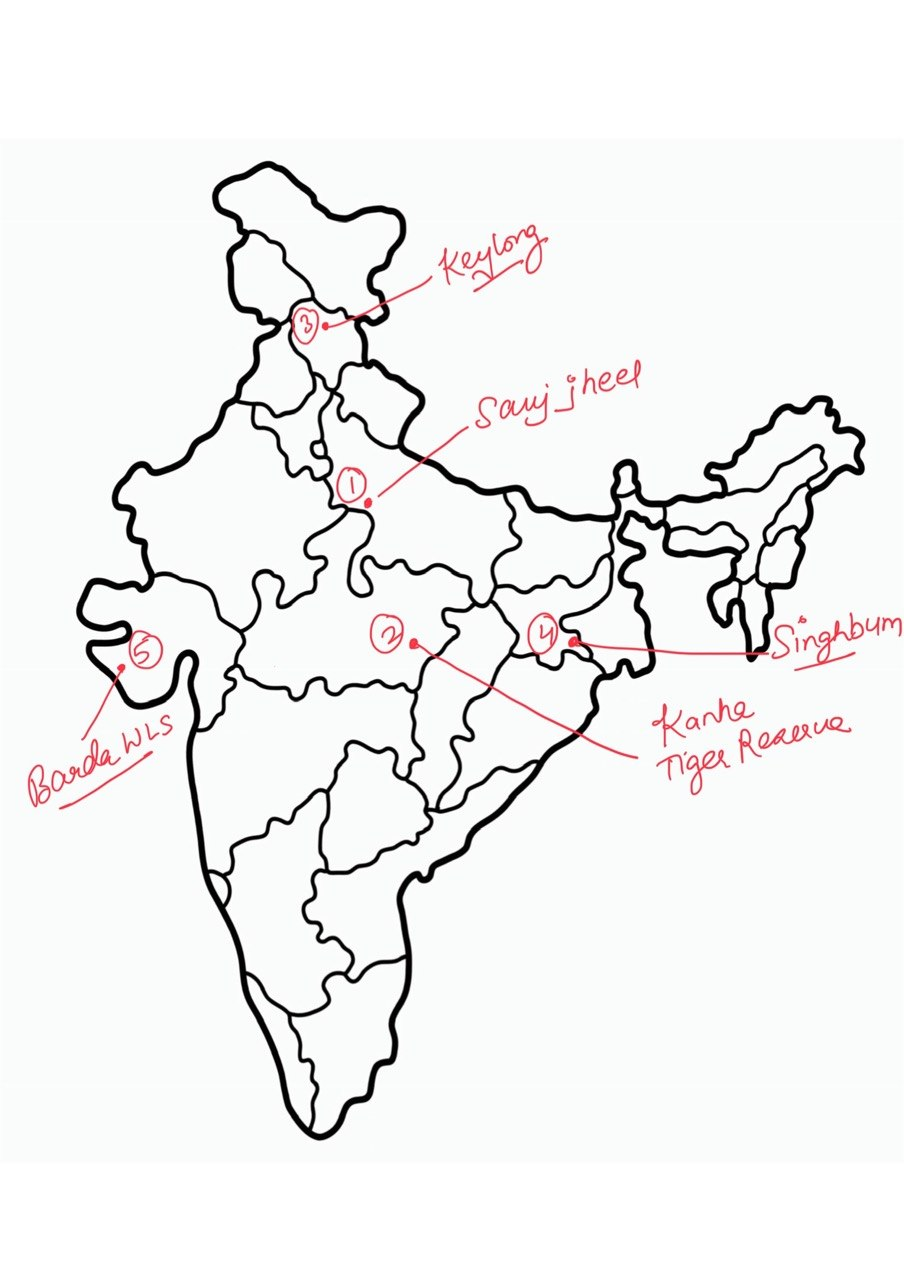
1. Sauj Jheel
Why in news : India's total number of Ramsar sites has increased to 103, following the designation of Sukhna Wetland (Chandigarh) and Sauj Jheel (Uttar Pradesh) as Wetlands of International Importance under the Ramsar Convention.
About:
- A shallow freshwater lake in the Ganga floodplain of Mainpuri district, surrounded by farmland. It is a key wintering stop for waterbirds on the Central Asian Flyway. With Saman Bird Sanctuary, Mainpuri is UP's only district with two Ramsar sites.
2. Kanha Tiger Reserve
Why in news : Madhya Pradesh has initiated the reintroduction of wild buffaloes in Kanha Tiger Reserve after their disappearance from the state’s forests for nearly 100 years.
About:
- Lies in the Maikal range of the Satpura hills (Mandla and Balaghat districts). Sal and bamboo forests mix with grassy meadows locally called 'maidans', drained by the Banjar and Halon, tributaries of the Narmada. Famous for saving the hard-ground barasingha.
3. Keylong
Why in news : The foundation stone of the ICMR Centre for High Altitude Medicine and Public Health Research (ICMR-CHAMP) was laid at Keylong in Lahaul and Spiti district, Himachal Pradesh, to strengthen research on high-altitude health challenges
About:
- District headquarters on the Bhaga river at about 3,000 m, on the Manali–Leh highway. A cold desert in the rain shadow of the Pir Panjal, now reachable year-round via the Atal Tunnel. Low oxygen makes it ideal for studying high-altitude health.
4. Singhbhum
Why in news : Elephant Reserves: India has 33 notified Elephant Reserves across 14 states, including Singhbhum (first), Terai and Agasthyamalai.
About:
- It is part of the Chota Nagpur Plateau, including the Saranda sal forests ('land of seven hundred hills'). Rich iron ore belt (Noamundi, Kiriburu) creates mining–elephant corridor conflict. The Singhbhum Craton holds some of India's oldest continental crust.
5. BARDA WILDLIFE SANCTUARY
Why in news: Asiatic lions have naturally returned to Barda after about 144 years; it now holds 17 lions and is being developed as a 'second home' beyond Gir (October 2026).
About:
- Covers about 192 sq km in the Barda hills of Saurashtra (Porbandar and Devbhumi Dwarka districts), with dry deciduous forest and grassland. A second population reduces the risk of keeping all lions in Gir, as the 2018 canine distemper deaths showed.
Fortnightly KOSMOS MCQs Practice - 24th October 2026
Q1. With reference to India's newest Ramsar sites (October 2026), consider the following statements:
1. Sukhna Wetland is the first Ramsar site in the Union Territory of Chandigarh.
2. Sauj Jheel lies in the Ganga floodplain in Mainpuri district, which now has two Ramsar sites.
3. India became a party to the Ramsar Convention in 1975, the year the Convention entered into force.
How many of the statements given above are correct?
- Only one
- Only two
- All three
- None
Q2. Barda Wildlife Sanctuary was recently in the news as a 'second home' for Asiatic lions. Consider the following statements:
1. It lies in the Saurashtra region, spanning Porbandar and Devbhumi Dwarka districts.
2. Lions returned to Barda through the translocation of an entire pride from Gir in 2023.
3. Chitals were translocated from Kuno National Park to Barda to strengthen the prey base.
How many of the statements given above are correct?
- Only one
- Only two
- All three
- None
Q3. In the context of the recent tiger reintroduction in Buxa Tiger Reserve, consider the following pairs:
Tiger Reserve — State
1. Buxa — West Bengal
2. Valmiki — Uttar Pradesh
3. Panna — Madhya Pradesh
4. Satkosia — Odisha
How many of the pairs given above are correctly matched?
- Only one
- Only two
- Only three
- All four
Q4. With reference to the seventh draft notification on the Western Ghats Ecologically Sensitive Area (ESA), consider the following statements:
1. It proposes about 56,825 sq km across six States as ESA.
2. It has been issued under the Wildlife (Protection) Act, 1972.
3. It imposes a blanket ban on farming and plantation activities within the ESA.
How many of the statements given above are correct?
- Only one
- Only two
- All three
- None
Q5. The Central Water Commission's reservoir bulletin (15 October 2026) drew attention to post-monsoon water stress. Consider the following statements:
1. The CWC bulletin monitors 178 major reservoirs across India.
2. The Pennar and Cauvery basins recorded the steepest storage deficits.
3. The Mahanadi and Narmada basins recorded below-normal storage.
4. The Pennar rises in Karnataka and drains into the Bay of Bengal.
How many of the statements given above are correct?
- Only one
- Only two
- Only three
- All four
Q6. The Baltic Sea was in the news over eutrophication and oxygen-depleted seabeds. Which of the following countries border the Baltic Sea?
1. Norway
2. Belarus
3. Lithuania
4. Finland
5. Germany
Select the correct answer using the code given below:
- 1, 3, 4 and 5
- 3, 4 and 5 only
- 2, 3 and 4 only
- 1, 2 and 5 only
Q7. With reference to the Cyclone Warning and Marine Weather Services Decision Support System (DSS) launched by IMD in October 2026, consider the following statements:
1. It was launched at IMD's biannual Pre-Cyclone Exercise Meeting, held since 2008.
2. It provides storm-surge information as well as rainfall forecasts for river catchments.
3. It is accessible to the general public through IMD and Regional Specialised Meteorological Centre websites.
How many of the statements given above are correct?
- Only one
- Only two
- All three
- None
Q8. Consider the following statements:
Statement-I: Official satellite-based counts of farm fires in Punjab may underestimate the actual extent of stubble burning.
Statement-II: The polar-orbiting satellites used for fire counts pass over the region around early afternoon, while many fires are now lit later in the afternoon.
Which one of the following is correct in respect of the above statements?
- Both Statement-I and Statement-II are correct, and Statement-II explains Statement-I
- Both Statement-I and Statement-II are correct, but Statement-II does not explain Statement-I
- Statement-I is correct, but Statement-II is incorrect
- Statement-I is incorrect, but Statement-II is correct
Q9. Consider the following pairs:
Conference/Event — Venue
1. CBD COP17 (October 2026) — Yerevan, Armenia
2. UNFCCC COP31 (November 2026) — Antalya, Türkiye
3. Adoption of the Kunming-Montreal Global Biodiversity Framework — CBD COP14, Sharm el-Sheikh
4. UNFCCC COP30 — Baku, Azerbaijan
How many of the pairs given above are correctly matched?
- Only one
- Only two
- Only three
- All four
Q10. The Ganga Waters Treaty between India and Bangladesh is approaching expiry. Consider the following statements:
1. Signed in 1996 for 30 years, the treaty is due to expire in December 2026.
2. Water sharing is calculated at the Farakka Barrage during the lean season (1 January to 31 May).
3. The Farakka Barrage is located in Bihar.
4. In Bangladesh, the Ganga is known as the Jamuna.
How many of the statements given above are correct?
- Only one
- Only two
- Only three
- All four
Share the article
Edukemy’s Current Affairs Quiz is published with multiple choice questions for UPSC exams
MCQ
Get Latest Updates on Offers, Event dates, and free Mentorship sessions.

Get in touch with our Expert Academic Counsellors 👋
FAQs
Geography Current Affairs focuses on the contemporary issues, events, and developments in the field of geography. It covers recent geographical phenomena, environmental changes, geopolitical shifts, and related news. This differs from regular geography studies which may focus more on foundational concepts, historical contexts, and theoretical frameworks.
Updates are provided regularly to ensure that subscribers stay informed about the latest developments in geography. Typically, updates are provided on a fortnightly basis, depending on the frequency of significant events and changes in the field.
Absolutely. Geography Current Affairs serves as a valuable resource not only for Geography optional but also for GS papers, especially GS Paper 1 (covering Indian Heritage and Culture, History, and Geography of the World and Society) and GS Paper 3 (covering Technology, Economic Development, Biodiversity, Environment, Security, and Disaster Management). It aids in building a holistic understanding of various topics and strengthens answer-writing skills by incorporating contemporary examples and perspectives.
Geography Current Affairs holds immense importance for UPSC preparation, particularly for aspirants opting for Geography optional. It helps candidates stay updated with the latest developments, geographical phenomena, environmental issues, and geopolitical shifts worldwide, aligning them with the dynamic nature of the subject as tested in the UPSC examinations.
