21 Aug
Climate change - Global Phenomenon with Regional Impacts
In News: IPCC Assessment Report 6 has made a regional impact assessment of climate change across the world.
Introduction: Climate Change is a Reality
- The first IPCC report, released in 1990, concluded that human-caused climate change would soon become evident, but could not yet confirm that it was already happening. Today, evidence is overwhelming that the climate has indeed changed since the pre-industrial era and that human activities are the principal cause of that change. The main human causes of climate change are the heat-absorbing greenhouse gases released by fossil fuel combustion, deforestation, and agriculture, which warm the planet and aerosols such as sulphate from burning coal, which have a short-term cooling effect that partially counteracts human-caused warming.
- Human-driven climate change can alter the regional characteristics of climate hazard by changing the magnitude or intensity of a climate hazard, the frequency with which it occurs, the duration that hazardous conditions persist, the timing when a hazard occurs, or the spatial extent threatened by a hazard. By examining each of these aspects of a hazard’s profile change, climate services may provide climate risk information that allows decision makers to better tailor adaptation, mitigation and risk management strategies.
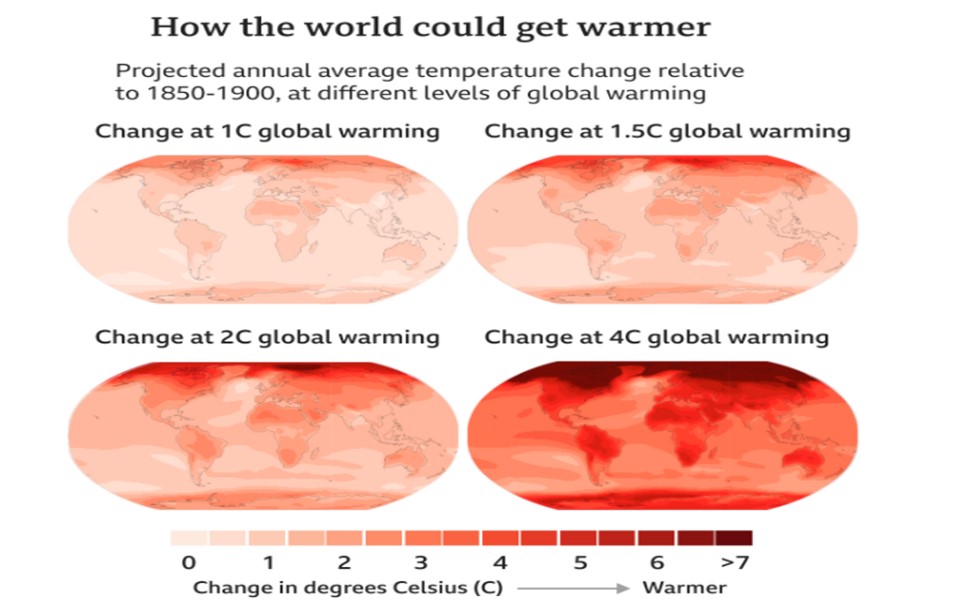
- The impact of climate change in a particular region is assessed through climatic impact-drivers (CIDs). A climatic impact-driver is a physical climate condition that directly affects society or ecosystems. CIDs may relate to temperature, the water cycle, wind and storms, snow and ice, oceanic and coastal processes or the chemistry and energy balance of the climate system. CIDs may represent a long-term average condition (such as the average winter temperatures that affect indoor heating requirements), a common event (such as a frost that kills off warm-season plants), or an extreme event (such as a coastal flood that destroys homes). Depending on system tolerance, CIDs and their changes can be detrimental, beneficial, neutral, or a mixture of each across interacting system elements and regions.
Linking global to regional climate change
Although climate change is a global phenomenon, its manifestations and consequences are different in different regions, and therefore climate information on spatial scales ranging from sub-continental to local is used for impact and risk assessments. In the following sections we will go into details of various regions having impacted by the climate change and projected future changes in climatic impact drivers.
Assessment of South Asia: Key features of the regional climate of South Asia
- The countries in this region are mostly semi-arid to arid and therefore depend heavily on the summer monsoon (June–September) which is when most of the precipitation falls over the South Asia region (SAS).
- The topographic mechanical effect of the Tibetan Plateau (TIB) promotes moisture convergence downstream which triggers the early summer monsoon onset particularly over the Bay of Bengal and South China.
- In winter, Westerly Disturbances (WD) brings moisture from the Atlantic Ocean. The WD interaction with Himalayas causes precipitation over northern and western parts of South Asia that is crucial to maintain the glacier mass balance.
- The observed teleconnection patterns over SAS for temperature shows cooling effects during Northern Annular Mode (NAM) and warming effect when in positive phase with ENSO, Indian Ocean Basin (IOB), Atlantic Meridional Mode (AMM) and Atlantic Multidecadal Variability (AMV). Indian Ocean Dipole (IOD) also influences South Asian precipitation.
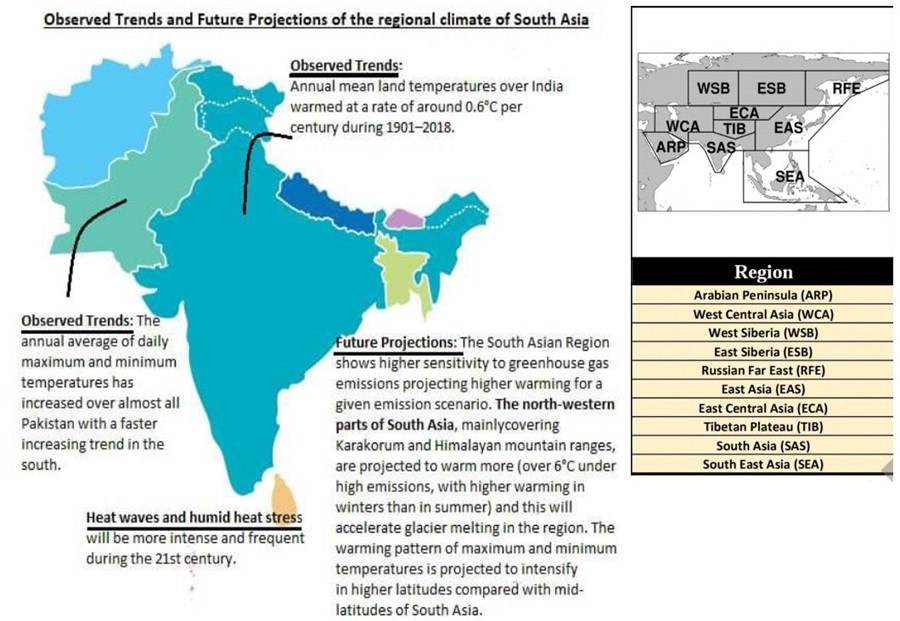
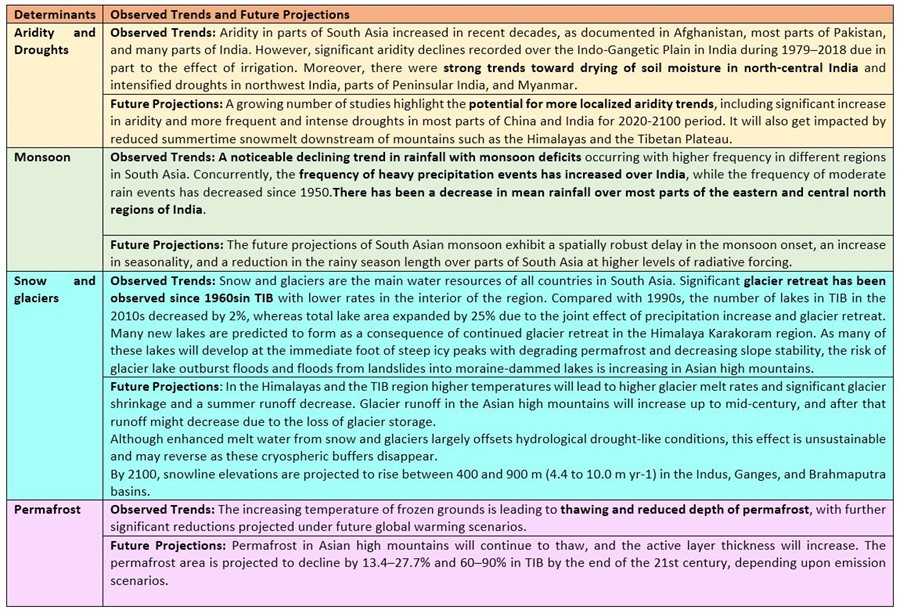
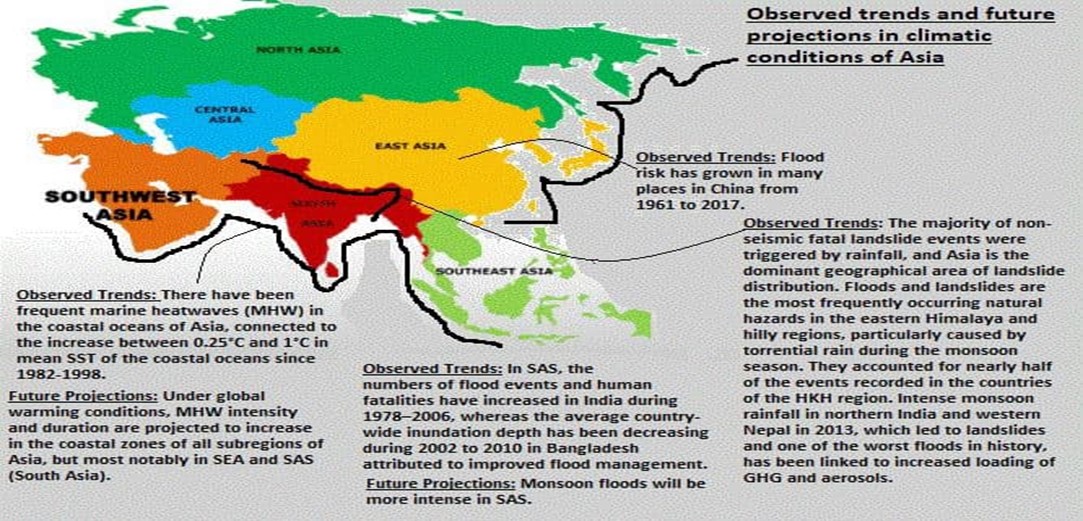
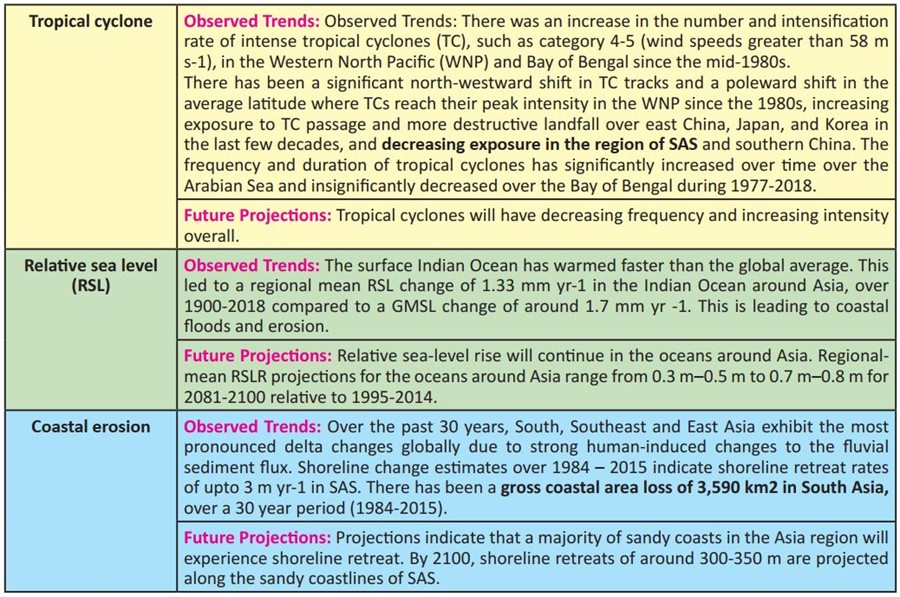
Assessment of current trends in observed impacts
Africa
Africa has many varied climates such as dry regime in Saharan region, tropical humid in West and East Africa except for parts of the Greater Horn of Africa (alpine) and the Sahel (semi‐arid), and a dry/wet season in the northern and southern African region including the Namibian desert. Madden-Julian Oscillation (MJO), Pacific Decadal Variability (PDV), and shift of the Atlantic ITCZ are the key climatic features characterizing the intra-seasonal and inter-annual variability of Africa.
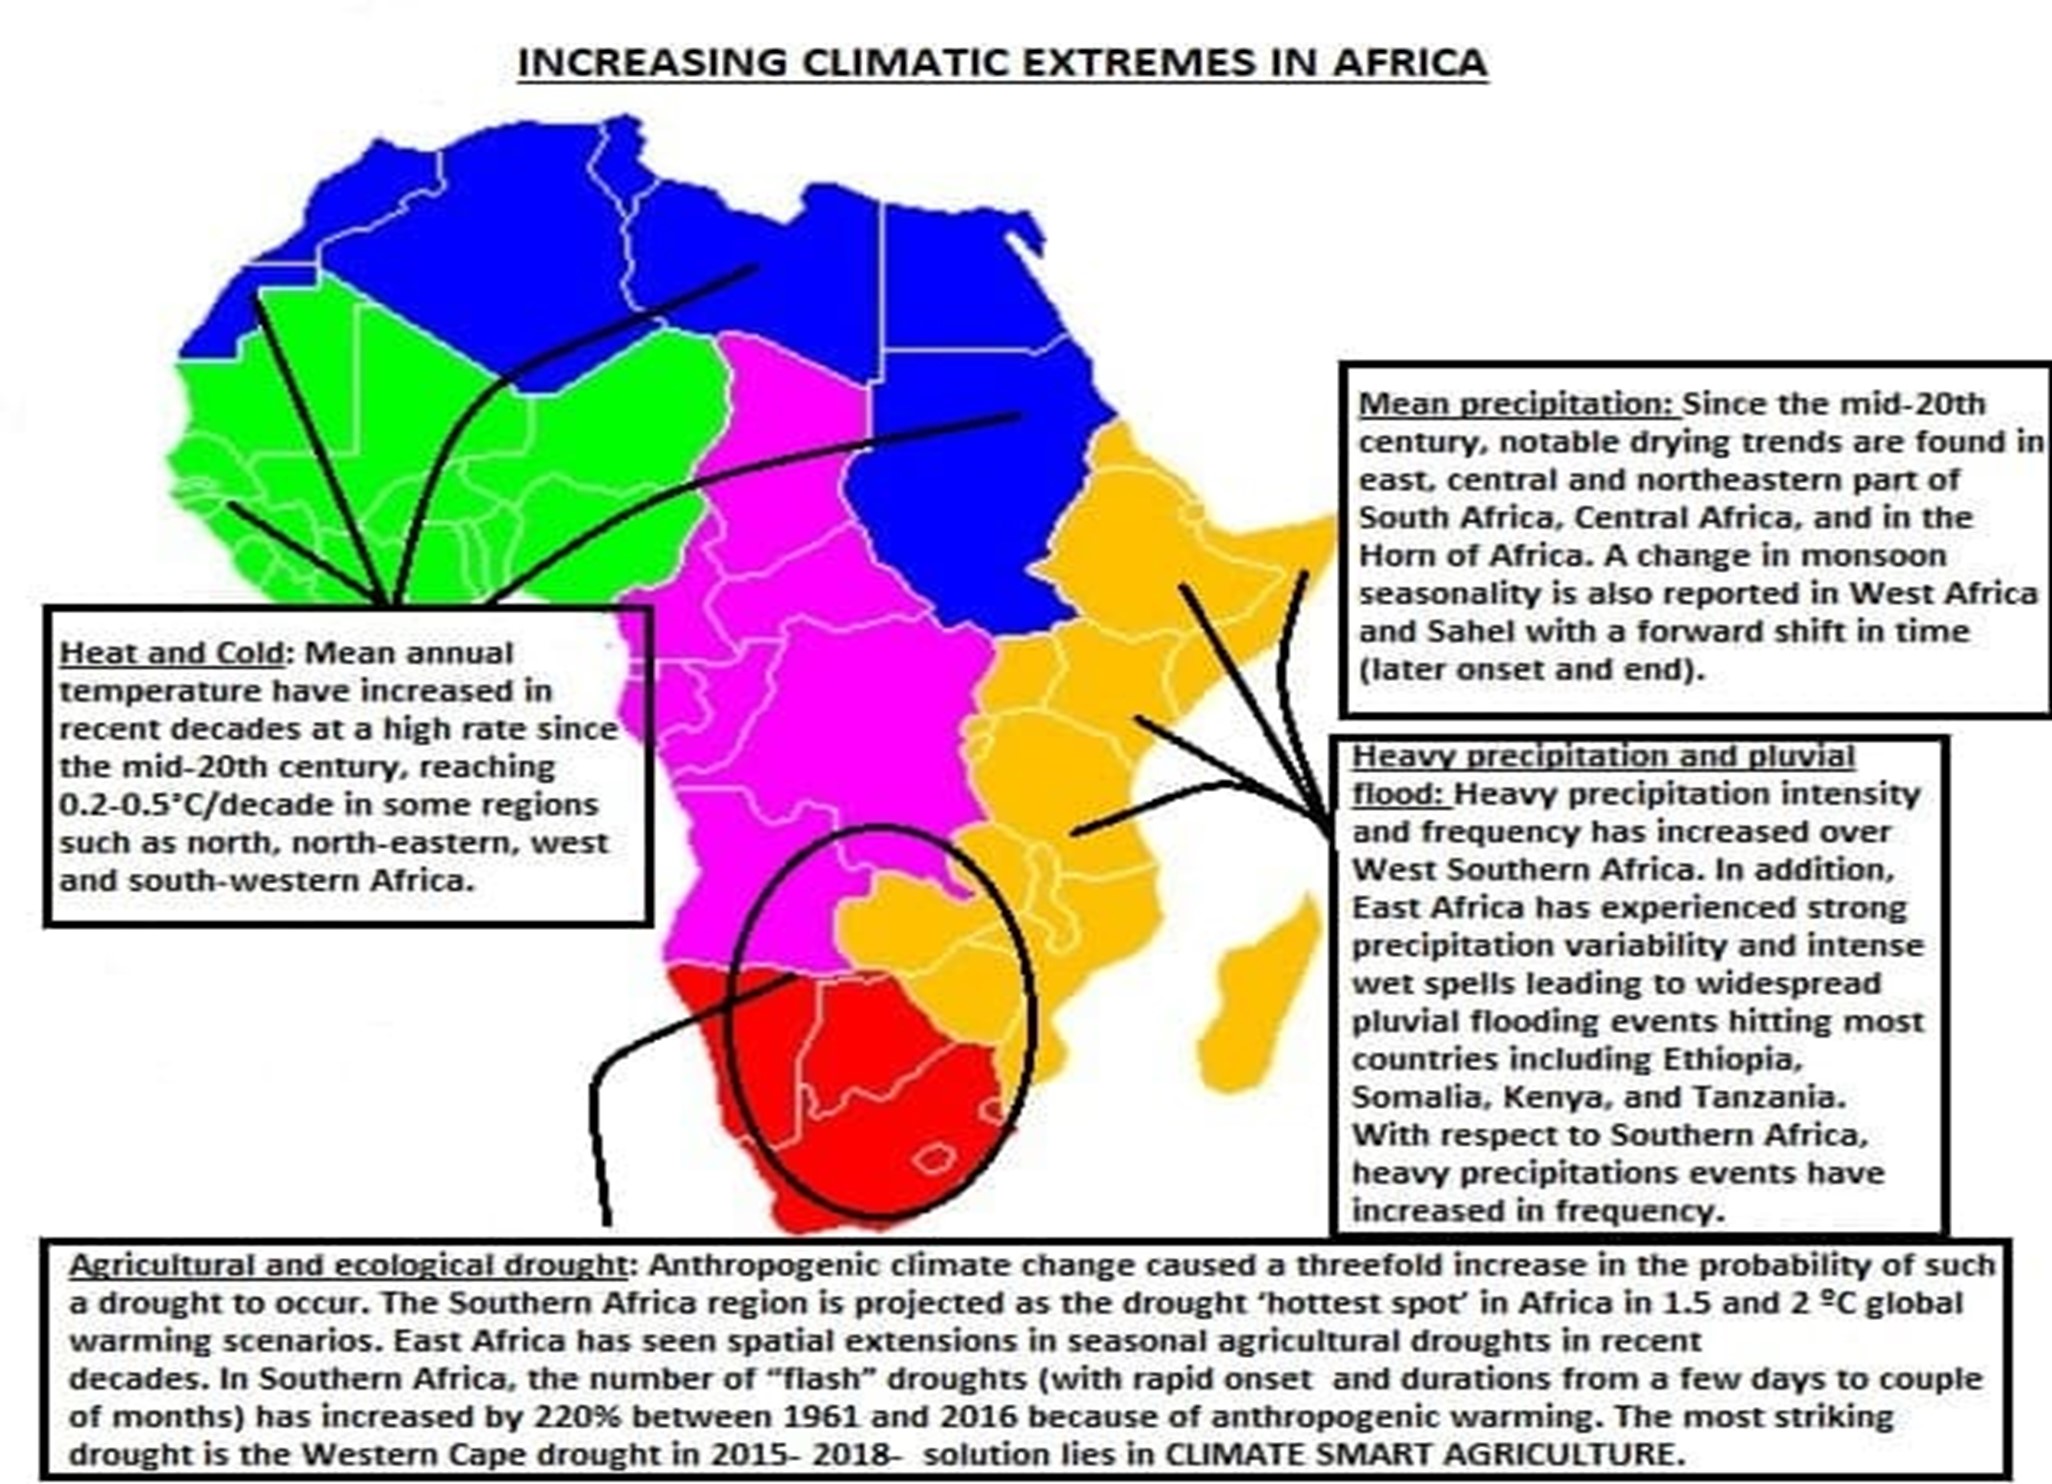
- Severe windstorm: The frequency of Mediterranean windstorms reaching North Africa, including Medicanes, is projected to decrease, but their intensities are projected to increase, by the mid-century and beyond.
- Tropical cyclone: In the Southern Indian Ocean, an increase of Category 5 cyclones has been observed in recent decades as in other basins. However, there is a projected decrease in the frequency of tropical cyclones making landfall over Madagascar, Southeastern Africa and East South Africa in a 1°C, 2°C and 3ºC warmer world.
- Snow and glacier: African glaciers are located in East Africa and more specifically on Mount Kenya, the Rwenzori Mountains and Mount Kilimanjaro, with glaciers reducing substantially in each region.
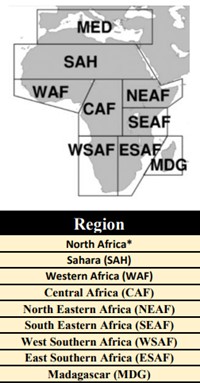
- Relative sea level (RSL): Around Africa, over 1900-2018, a regional mean RSL change of 2.07 mm yr-1 in the South Atlantic and 1.33 mm yr-1 in the Indian Ocean is recorded.
- Coastal erosion: Shoreline retreat rates up to 1 m yr-1 have been observed around the continent during 1984– 2015, except in ESAF. At the more regional level, in Ghana along the Gulf of Guinea, about 79% of the shoreline was found to be retreating while 21% was found to be stable or prograding over the period 1974–1996.
- Marine heat wave (MHW): Changes over the 20th century show an increase in frequency between 0.5 and 2.0 MHW per decade over the region, especially off the Horn of Africa; an increase in intensity per event around South Africa; and an increase in MHW duration along the North African coastlines. MHWs will increase around Africa. Mean SST is projected to increase by 1 ºC (2ºC) around Africa by 2100, with a hotspot of around 2 ºC (5ºC) along the coastlines of South Africa.
Central and South America
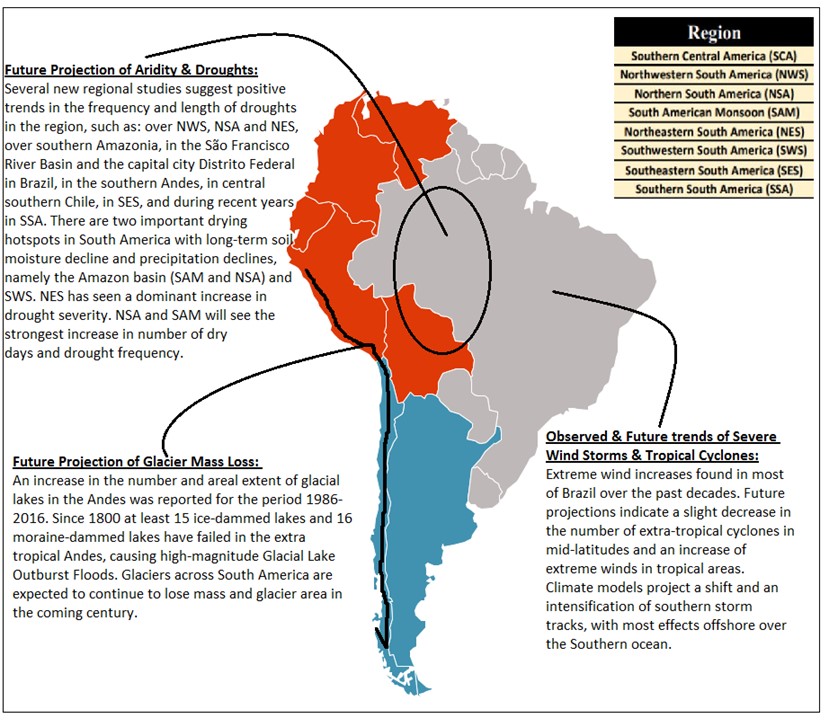
Its climate varies from tropical, subtropical to temperate and topography includes tropical rainforests, Atacama Desert, plateaus, Andes cordillera and coastal regions. This region is influenced by trades, westerlies and ocean currents along with teleconnection like ENSO etc.
- Heat and Cold: There are increased heat waves in all regions but SSA over the past decades. A decreasing frequency of cold days and nights has been observed in many sub regions. There is decrease in frost days in SWS, SES and SSA. Warming is projected across all sub-regions, with the largest increases taking place in the Amazon Basin (NSA and SAM). Daily mean temperature exceedances of a typical 21.5°C threshold for a successful incubation of disease pathogens inside many mosquito vectors will be crossed much more frequently, potentially driving increases in the incidence of vector-borne diseases.
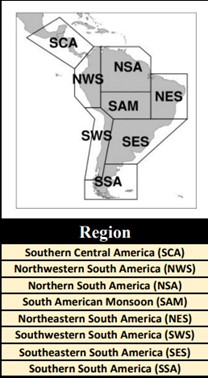
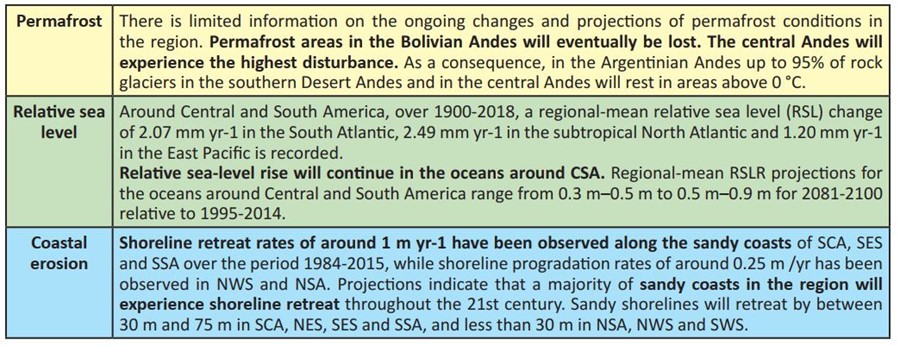
- Mean precipitation: Diverse historical precipitation trends are documented in the region, including: a small but not significant increasing trend in SCA, a decreasing trend in south-eastern and north-eastern Brazil, and an increasing trend in SSA. Projections indicate a drying signal for SCA, NES and SWS and the well-known dipole for South America, meaning increasing precipitation over subtropical regions like the Río de La Plata basin (SES) and decreased precipitation in the Amazon (NSA).
Europe
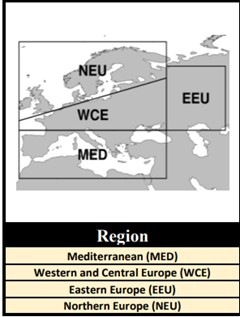
Westerly winds and the accompanying Atlantic storm track with cyclones and anticyclones travelling from the Atlantic towards inland Europe and Siberian High in winter are the main climatic features that characterize daily to inter-annual variability in the European region. A combination of increasing temperature and decreasing precipitation will make the region more arid, with an increase in agricultural, ecological and stream flow droughts.
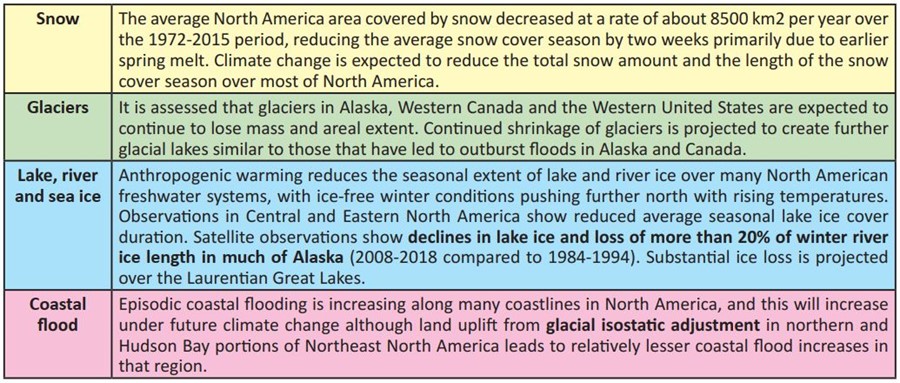
- Snow: Widespread and accelerated declines of snow depth are currently observed in Europe. In the Pyrenees a slow snow cover decline has been observed starting from the industrial period with a sharp increase since 1955.
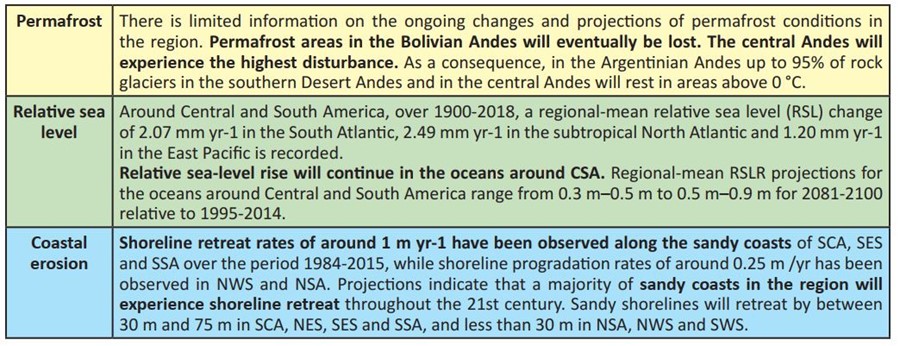
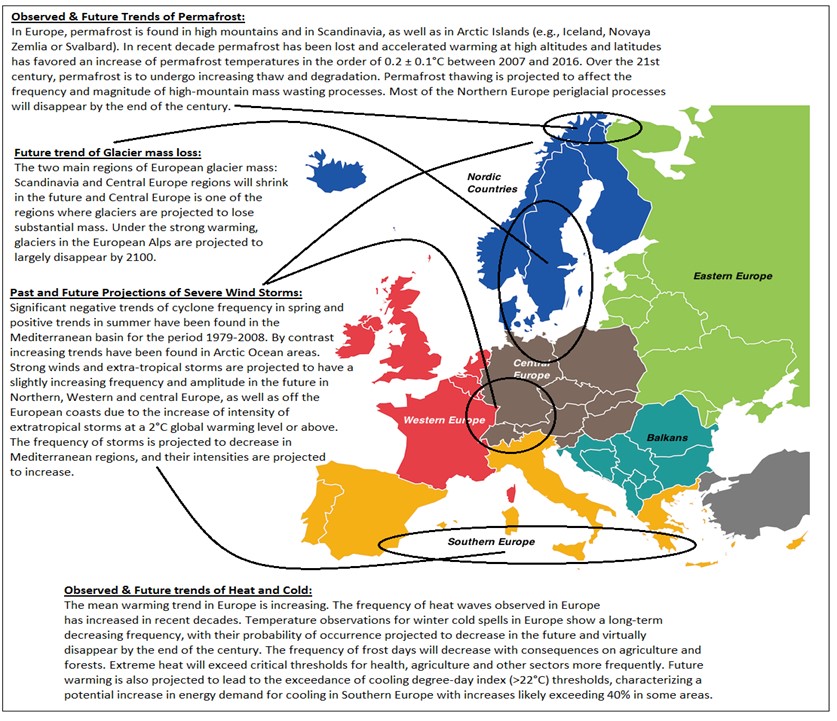
- Relative sea level (RSL): Around Europe, over 1900-2018, regional mean RSL change of 1.08 mm yr-1 is recorded in the sub polar North Atlantic. For period 1993-2018, the RSLR rates increased to 2.17 mm yr-1.Regional-mean RSLR projections for the oceans around Europe range from 0.4 m–0.5 m to 0.7 m–0.8 m for 2081-2100 relative to 1995-2014. The signal is strongest for the North Sea and Atlantic coasts, followed by the Black Sea. The Baltic Sea on the contrary shows the lowest increase due to land uplift.
- Marine heat wave (MHW): The mean SST of the Atlantic Ocean and the Mediterranean has increased between 0.25°C and 1°C since 1982-1998. This mean ocean surface warming is correlated to longer and more frequent marine heat waves in the region. Over the period 1982-2016, the coastlines of Europe experienced on average more than 2.0 MHW per year, with the eastern Mediterranean and Scandinavia experiencing 2.5–3 MHWs per year. Mean SST is projected to increase by 1ºC to 3ºC around Europe by 2100, with a hotspot of around 4ºC to 5ºC along the Arctic coastline of Europe, leading to a continued increase in MHW frequency, magnitude and duration.
North America
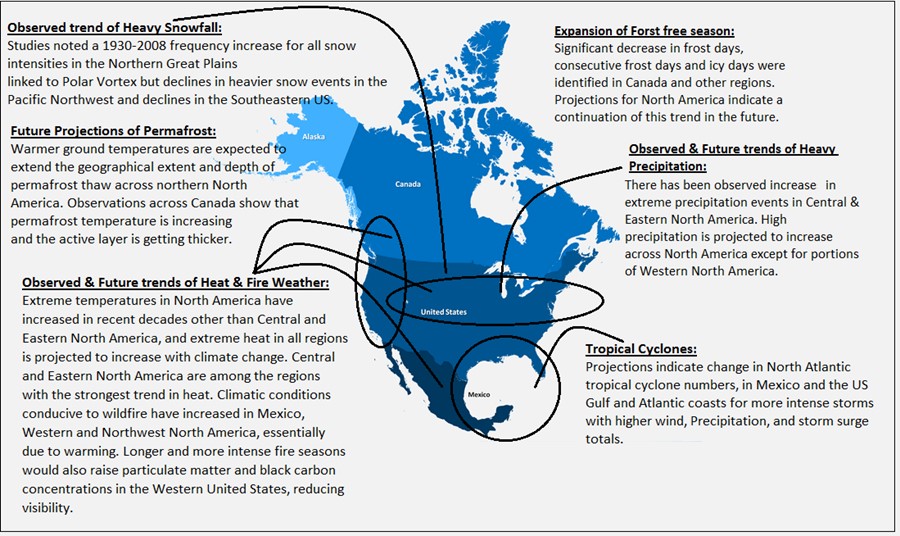
North America covers all main climate types. Important geographical features influence local climates, like the Rocky Mountains through cyclogenesis and the Great Lakes through lake-effect snowfall. The cryosphere is an important component of the climate system in North America. Ocean induced variability such as tornadoes, North Atlantic Oscillation (NAO) and ENSO affect its climate. Under climate change, Tropical cyclones, severe wind and dust storms in North America are “shifting toward more extreme characteristics”.
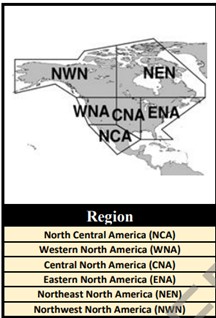
- Cold spell: The number of days with extreme wind chill hours (humidex<-30) decreased at 76% of examined Canadian stations from 1953-2012 and cold days and coldest nights decreased in Mexico from 1980-2010. Cold spells are projected to decrease over North America under climate change, with the largest decreases most common in the winter season.
- Landslide: There is growing but yet limited evidence for unique climate-driven changes in landslide and rock fall hazards in North America, even as theory suggests decreases in slope and rock face stability due to more intense rainfall, rain-on-snow events, mean warming, permafrost thaw, glacier retreat, and coastal erosion although dry trends can decelerate mass movements.
- Hydrological drought: Increases in hydrological drought frequency (particularly the 100 yr drought) were far more prevalent than for meteorological drought across watersheds in the US and Canada, indicating a strong influence of evaporative demand.
- Agricultural and ecological drought: More intense agricultural and ecological drought conditions are projected over North Central America, Western North America and Central North America in a 2℃ global warming level (about mid-century).
Australasia
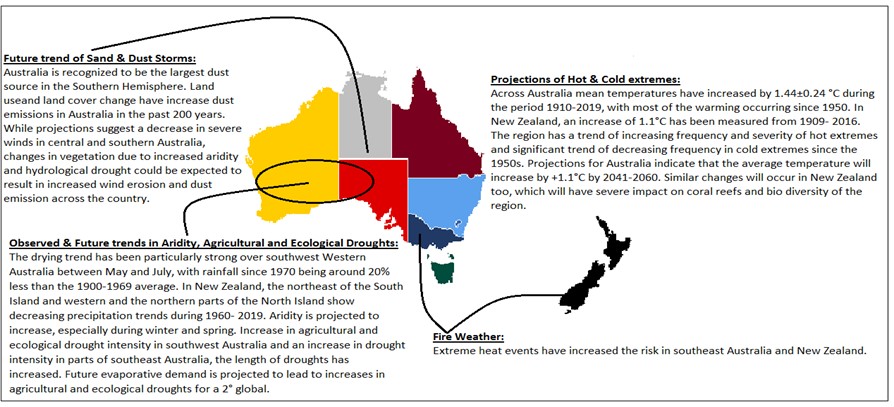
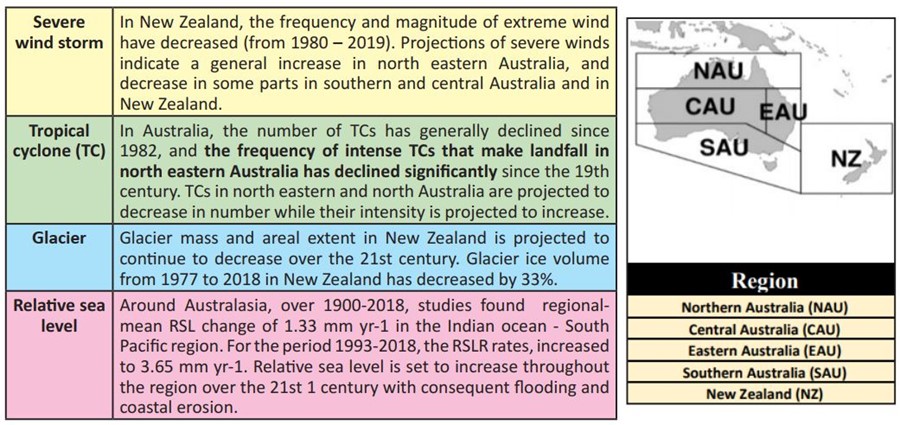
Various remote drivers have notable teleconnection to regions within Australasia, including an effect of the El Niño Southern Oscillation and the Indian Ocean Dipole. Much of southern NZ and SAU are affected by systems within the westerly mid-latitude circulation, in turn affected by the Southern Annular Mode. The monsoon and the Madden-Julian Oscillation affect rainfall variability in northern Australia.
- Mean precipitation: Detectable anthropogenic increases in precipitation in Australia have been reported particularly for north central Australia. In New Zealand, increases in annual rainfall have been observed between in the south and west of the South Island and east of the North Island. Rainfall extremes have been detected to increase in Australasia. Annual mean precipitation is projected to increase in central and north east Australia and in the south and west of New Zealand with Consequent River flooding and pluvial flooding.
- Landslide: Based on local slope characteristics, lithology and seismic activity, the South Island and the 14 eastern half of the North Island of New Zealand are vulnerable to landslide occurrence. The potential for land and rockslides increases with, amongst other factors, total precipitation rates, precipitation intensity, mountain permafrost thaw rates, glacier retreat and air temperature.
Small islands
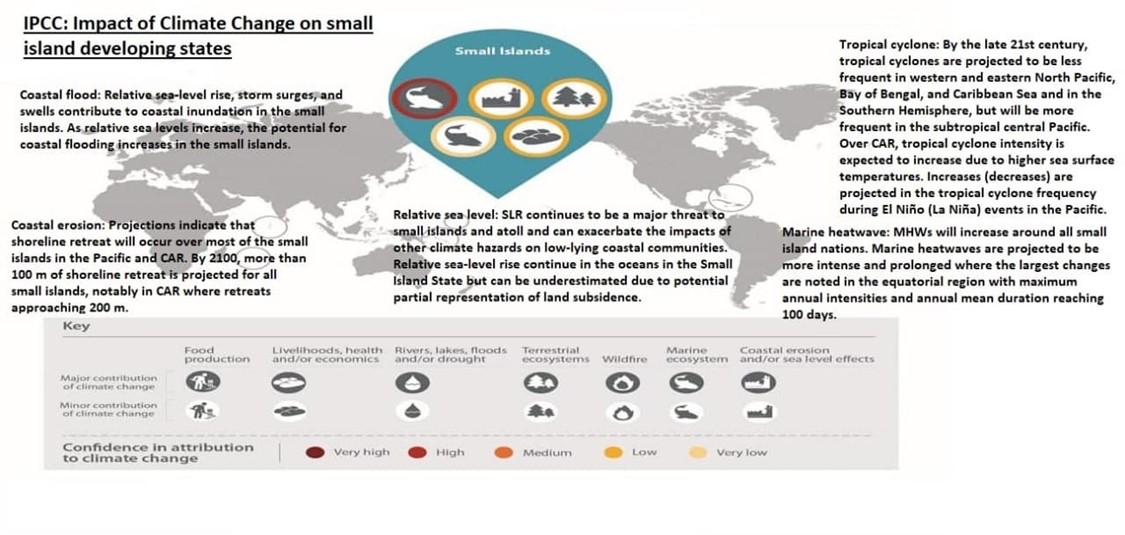
- This section covers small islands around the world with a particular focus on small islands in the Caribbean (CAR) Sea and the Pacific Ocean. Caribbean and Pacific small islands have tropical climates and local conditions are also influenced by diverse topography ranging from low-lying and atolls to volcanic and mountainous terrain. Climate variability in these islands is influenced by the trade winds, the easterly waves, tropical cyclones (TC), and the migrations of the Inter-Tropical Convergence Zone (ITCZ), the North Atlantic Subtropical High, and the South Pacific Convergence Zone (SPCZ).
- Heat and Cold: Significant warming trends are evident in the small islands in the 20th century. The warming signal in the tropical western Pacific has been attributed to anthropogenic forcing. Significant drying trends are noted in the southern Pacific subtropics and southwestern Polynesia and in some areas of Hawaii.
There will be warming over small islands even at 1.5°C global warming level (GWL). Mean temperature is to increase by 2041–2060.
- Heavy precipitation and pluvial flood: Heavy precipitation days in CAR have increased in magnitude, and more frequent in the northern part during the late 20th century. This trend will continue.
- Aridity: A heterogeneous and prevalent drying trend is found in CAR. Increased aridity and decreased freshwater availability projected in many small islands due to higher evapotranspiration in a warmer climate that partially offsets increases or exacerbates reductions in precipitation. Increased aridity is projected for the majority of the small islands.
- Agricultural and ecological drought: It will increase in frequency, duration, magnitude, and extent in the small islands, particularly where there are future declines in precipitation compounded by higher evapotranspiration.
- Fire weather: Drying and warming trends tend to increase fire probability from the climate impact on fuel loading, e.g., grassland fires in Hawaii and wildfires in Puerto Rico.
- Mean wind speed: Increase in annual winds in CAR, associated with changes in the extension of the North Atlantic Subtropical High that enhances the Caribbean low-level jet during the wet season, and stronger local easterlies due to enhanced land-ocean temperature differences in the dry season.
- Tropical cyclone: By the late 21st century, tropical cyclones are projected to be less frequent in western and eastern North Pacific, Bay of Bengal, and Caribbean Sea and in the Southern Hemisphere, but will be more frequent in the subtropical central Pacific. Over CAR, tropical cyclone intensity is expected to increase due to higher sea surface temperatures but can be inhibited by increases in vertical wind shear in the region. Increases (decreases) are projected in the tropical cyclone frequency during El Niño (La Niña) events in the Pacific by the end of the 21st century.

Polar terrestrial regions
Here, polar terrestrial regions include: Greenland and Iceland, the Russian Arctic, Antarctica, and the arctic portions of Northern Europe and North America.
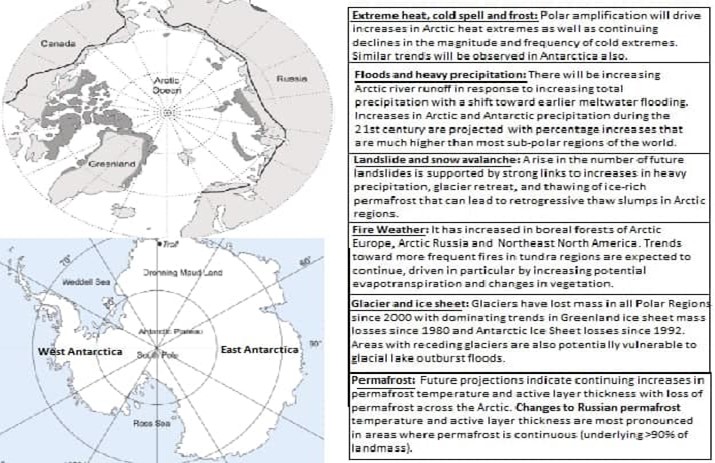
- Aridity and drought: Drainage from permafrost thaw, higher potential evapotranspiration, and changing seasonal patterns of melt have caused lake reduction and soil moisture deficits in several areas that match with projections of future drought increase.
- Mean wind speed and severe storm: It is projected that a strengthening of the Southern Annular Mode would decrease easterlies along Antarctica’s coasts with only small changes in katabatic winds (although this effect may diminish with stratospheric ozone recovery). In Greenland, reduction in mean winds over the interior is projected by 2100 while coastal winds will increase.
- Snow: In the Arctic, overall snow extent and seasonal duration are projected to continue declines, although mid-winter snowpack increases in some of the coldest and high-elevation locations. Higher temperatures result in a higher percentage of Arctic precipitation falling as rain, with most land regions (outside of Greenland and Antarctica) dominated by rainfall (more than 50% of total precipitation).
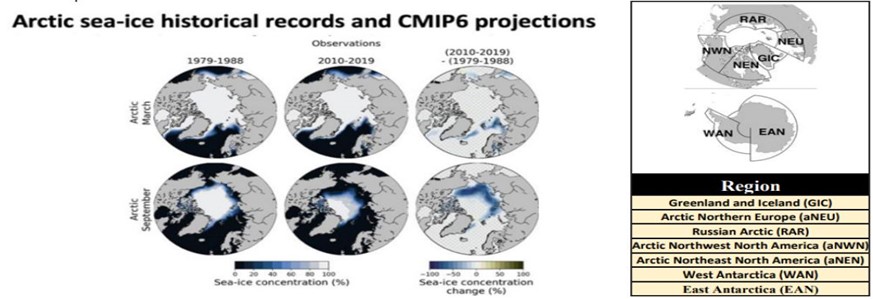
- Sea ice: Arctic sea ice thickness, extent, and average age have significantly decreased over the past four decades. Declines in land fast ice are most rapid in the Laptev Sea, are breaking perennial landfast ice blocking ocean channels in the Canadian Archipelago, and declining in the cold season by 7% across the Arctic. Perennial sea ice is being replaced by thin, seasonal ice, although multi-year ice will persist above the Canadian Archipelago and drift into sea transportation lanes.

The IPCC 6th report concludes that it is “unequivocal” that humans have warmed the planet, causing “widespread and rapid” changes to Earth’s oceans, ice and land surface. Many of these changes – particularly to the oceans, ice sheets and global sea levels – are “irreversible”. Abrupt changes and “tipping points” – such as rapid Antarctic ice sheet melt and forest dieback – cannot be ruled out. The possibilistic approach of human changing its environment in such dictating terms has led us to a tipping point of Limits to growth. We need to reorient ourselves toward more sustainable environmentalism and secure everyone a good quality of life in a good quality environment. This welfare approach of man-environment relationship based on sustainable development concept must be the way forward.
Where it can be used: Paper1: Climatology (Monsoons, climate change), Economic Geography (world agriculture), And Regional Planning. Paper2: Physical setting (mechanism of Indian monsoon), Agriculture, Regional planning and development, contemporary issues. GS: Paper1 (features of world’ geography-monsoon). Paper 3 (Environment-climate change)
Atlantic Meridional Overturning Circulation (AMOC)
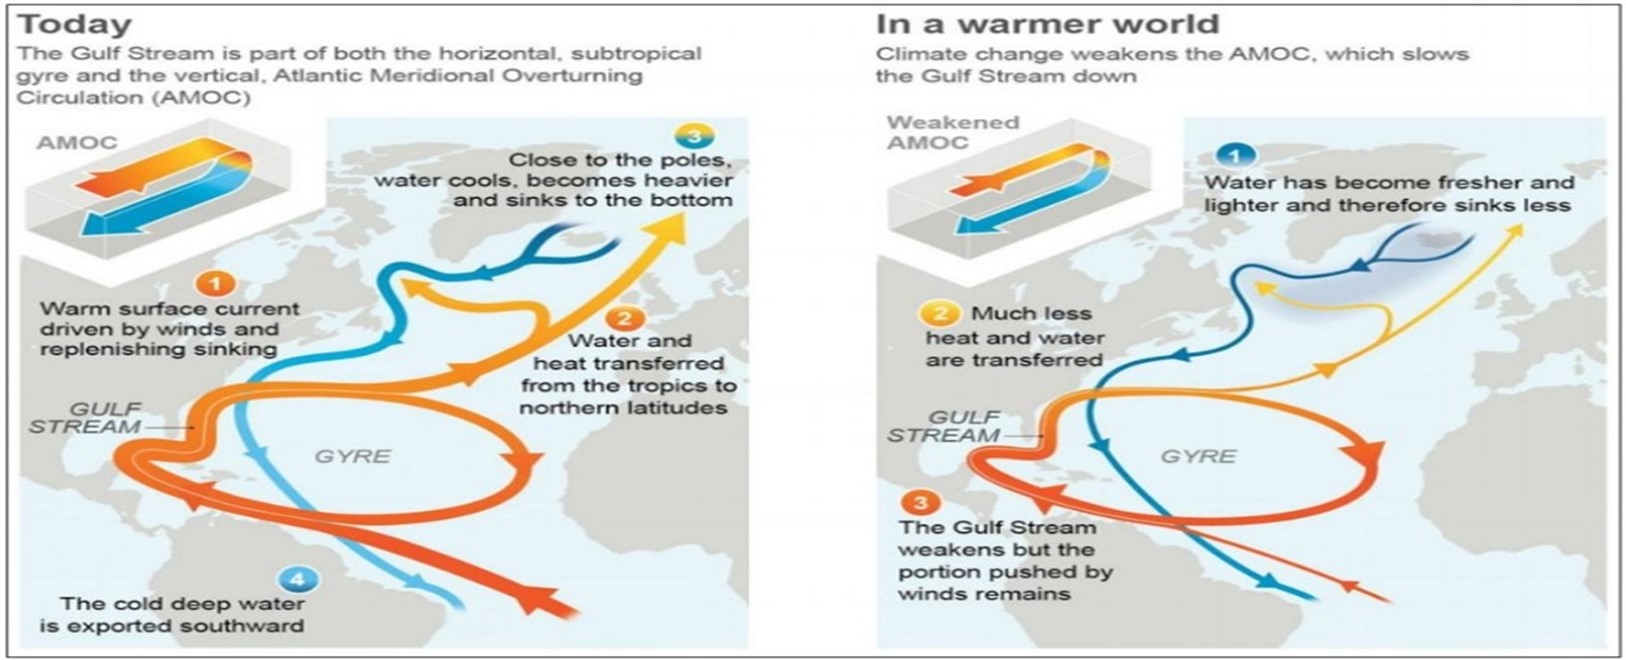
- AMOC, also known as “Atlantic Conveyor Belt”, is a system of currents in the Atlantic Ocean that brings warm water up to Europe from the tropics and beyond.
- How it works?It is driven by the differences in the temperature and salinity of the oceans across the latitudes. As warm water flows northwards it cools and some evaporation occurs, which increases its Low temperature and high salinity makes the water denser & sinks deep into the ocean. This cold, dense water slowly spreads southwards, several kilometers below the surface. Eventually it gets pulled back to the surface and warms in a process called upwelling and the circulation complete.
- Significance: Aids in distributing heat and energy around the globe, Responsible for keeping the Europe continent relatively warm and acts as the largest carbon sink in the northern hemisphere.
- According to the latest IPCC’s report (AR6) on climate change, AMOC is weakening and losing its stability.
- Why it’s weakening? Global warming led to rapid melting of Arctic ice. The freshwater from the melting ice reduces the salinity & density of the water, which is now unable to sink as it used to and weakens the AMOC flow.
- Effects of its weakening: Colder northern hemisphere, decreased rainfall over Europe, southward shift in the tropical rain belt, weakening of the African and Asian monsoons and strengthening of southern hemisphere monsoons.
Atmospheric River
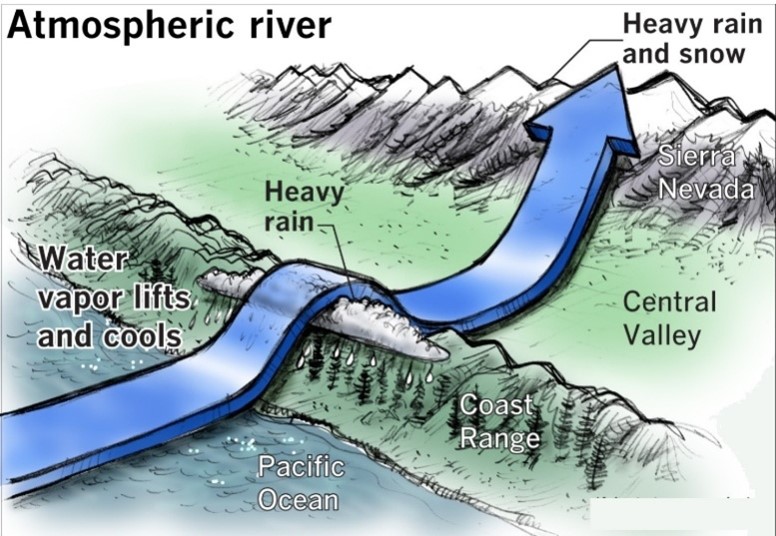
- ARs are relatively long, narrow, shallow and horizontal water vapour transport systems in the atmosphere – like rivers in the sky – that transport moisture from tropics to mid and high latitudes.
- Significance: On any given day, ARs account for over 90% of the global Meridional (north-south) water transport yet they cover less than 10% of earth’s circumference.
- How do they occur? ARs are associated with a low-level jet stream ahead of the cold front of an extra tropical cyclone. A cold front sweeps up water vapor in the warm sector when it catches up with the warm front. This causes a narrow band of high water vapor content to form ahead of the cold front at the base of the warm conveyor belt airflow.
- Where do they occur? ARs typically occur in the extra tropical North Pacific/Atlantic, southeastern Pacific, and South Atlantic oceans often making landfall on the west coasts of North and South America.
- Examples: Pineapple Express, a strong atmospheric river that is capable of bringing moisture from the tropics near Hawaii over to the U.S. West Coast.
- Impacts: They are also the major cause of extreme precipitation events that cause severe flooding in many mid-latitude, westerly coastal regions of the world. Equally, the absence of ARs has been linked with the occurrence of droughts in several parts of the world including South Africa, Spain and Portugal.
- Effect of Climate change on ARs: Due to global warming, there was an increasing trend in the AR activity since the mid-20th century &Climate change is leading to shifts in energy flows, expanding regions of stable, warm and dry air in the subtropics, which shifts atmospheric rivers poleward. Atmospheric river storms are projected to increase in intensity and duration in a warming climate.
Polar Amplification
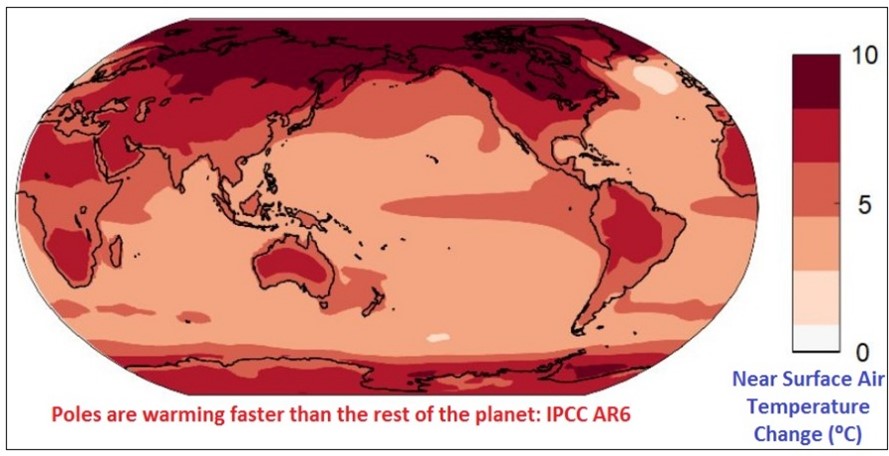
- It describes the phenomenon where surface temperature change at high latitudes exceeds the global average surface temperature change in response to radiative forcing of the climate system.
- Causes: According to the latest IPCC’s report (AR6) on climate change, several processes contributed to polar amplification under greenhouse gas forcing including the loss of sea ice and snow (an amplifying surface-albedo feedback), confinement of warming near the surface in the polar atmosphere (an amplifying lapse-rate feedback) and increased poleward atmospheric & ocean heat transport.
- Effects: Global sea level rise due to melting of polar ice, melting of Arctic permafrost which again releases potent GHGs like CO2 and Methane into the atmosphere & their release exacerbates global warming, weakening of polar vortex, and shifting in the positions of jet streams, effect on marine and terrestrial ecosystems and effect on global food chain.
- According to IPCC’s AR6, Polar amplification is much stronger in the Arctic than in Antarctica because of two main processes. 1) In the Southern Hemisphere, the heat taken up by the southern ocean is predominantly transported away from Antarctica by northward flowing surface waters. 2) Asymmetry in radiative feedbacks between the poles.
Forest Dieback
Forest dieback refers to the phenomenon of trees losing health and dying without an obvious cause.
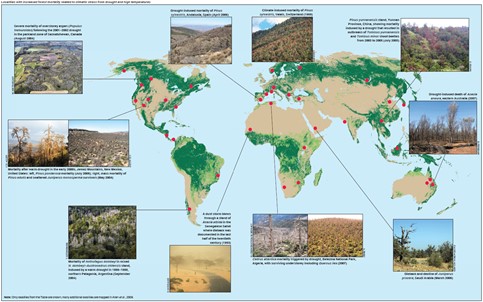
- Climate change is one of the cause of forest dieback which drives changes to vegetation composition through disturbances that lead to biome shifts and increasing tree mortality rates. This may reduce carbon turnover time and storage and increase temperatures and vapor pressure deficit leading to abrupt biogeochemical changes in tropical rain forest dieback, temperate and boreal forest dieback.
- Such transitions may be related to
- Large-scale changes in mean climate conditions crossing particular climate thresholds known as tipping point. (Tipping point: a critical threshold beyond which a system reorganizes, often abruptly and irreversibly)
- Temperature and precipitation extreme
- Possible enhancement and intermittency in fire activity.
- Examples:
- Dying back of Tropical Upper Montane Rain Forests- a severe environmental crisis in Sri Lanka.
- Tropical forest dieback in Amazon watershed.
- Boreal forest dieback in boreal Eurasia and North America.
Forests may be more vulnerable to indirect climate change effects such as insect outbreaks and diseases, disturbances such as wildfire and droughts. In general, forests are most vulnerable when climate change is combined with increased rates of deforestation.
Where it can be used: Paper1: Climatology (Monsoons, climate change), Economic Geography (world agriculture), And Regional Planning. Paper2: Physical setting (mechanism of Indian monsoon), Agriculture, Regional planning and development, contemporary issues. GS: Paper1 (features of world’ geography-monsoon). Paper 3 (Environment-climate change)
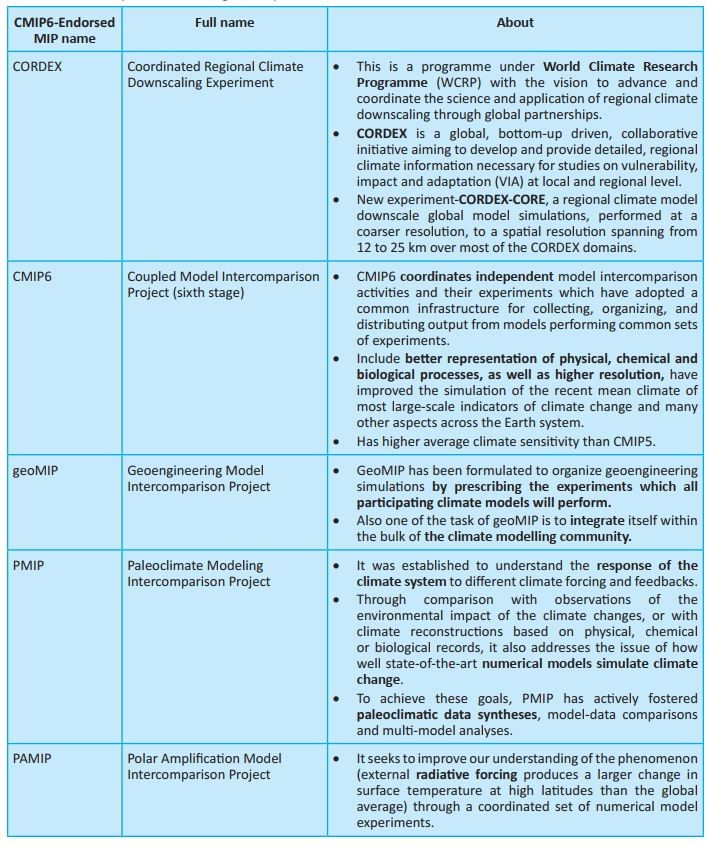
Modelling In Climate Studies
Climate models are important tools for improving our understanding and predictability of climate behaviour on seasonal, annual, decadal, and centennial time scales.
- One of the important aspects of study of climate science in comparative study of results from multi-model stimulations and against observation which helps in achieving a much realistic view of the climate condition.
- Some of the important modelling techniques are:
Climate Change over Hindu Kush Himalayas (HKH)
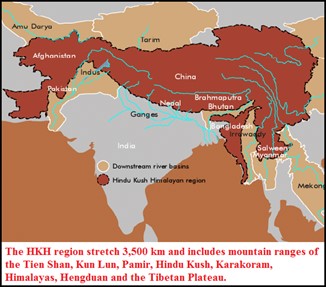
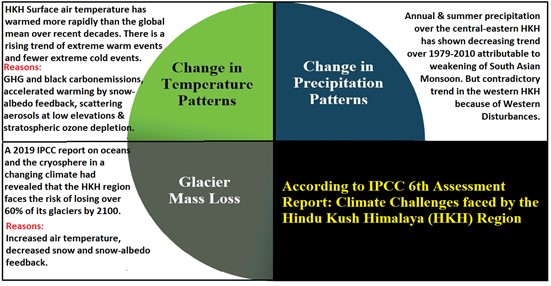
Background: The Hindu Kush Himalaya (HKH) constitutes the largest glacierized region outside the poles and provides the head waters for several major rivers. Since the 1960s, HKH has experienced significant trends in the mean and extremes of temperature and precipitation, accompanied by glacier mass loss and retreat, snow melt and permafrost degradation.
IPCC’s AR 6 asserted that black carbon (BC) emissions are making a significant contribution to total glacial melting in the HKH region. BC concentration is seven to ten times higher in mid-latitudes than at the high latitudes. However, the snow cover in Karakoram and Western HKH is increasing due to a phenomenon called Karakoram Anomaly, and partially attributed to an increase in strength of Western Disturbances.
Initiatives taken to tackle the climate challenges in the HKH region:
International Centre for Integrated Mountain Development (ICIMOD)
- It is a regional intergovernmental learning and knowledge sharing centre serving the eight regional member countries of the Hindu Kush Himalayas (Afghanistan, Bangladesh, Bhutan, China, India, Myanmar, Nepal, and Pakistan).
- Objective: To enable sustainable and resilient mountain development for improved and equitable livelihoods through knowledge and regional cooperation.
- It has taken up several regional initiatives to tackle the climate challenges in the region. Such as:
- Hindu Kush Karakoram Pamir Landscape Initiative (HKPL)
- Kanchenjunga Landscape Conservation and Development Initiative (KLCDI)
- Renewable Energy and Energy Efficiency Capability for the Hindu Kush Himalaya (REEECH)
- Himalayan Climate Change Adaptation Programme (HICAP)
- Hindu Kush Himalayan Monitoring and Assessment Programme (HIMAP)
- Reducing Emissions from Deforestation and Forest Degradation (REDD+)
Where this case study can be used?
This case study can be used in topics related to Paper 1 (Global climate change, Sustainable development, Hydrological cycle), Paper 2 (Sustainable development).
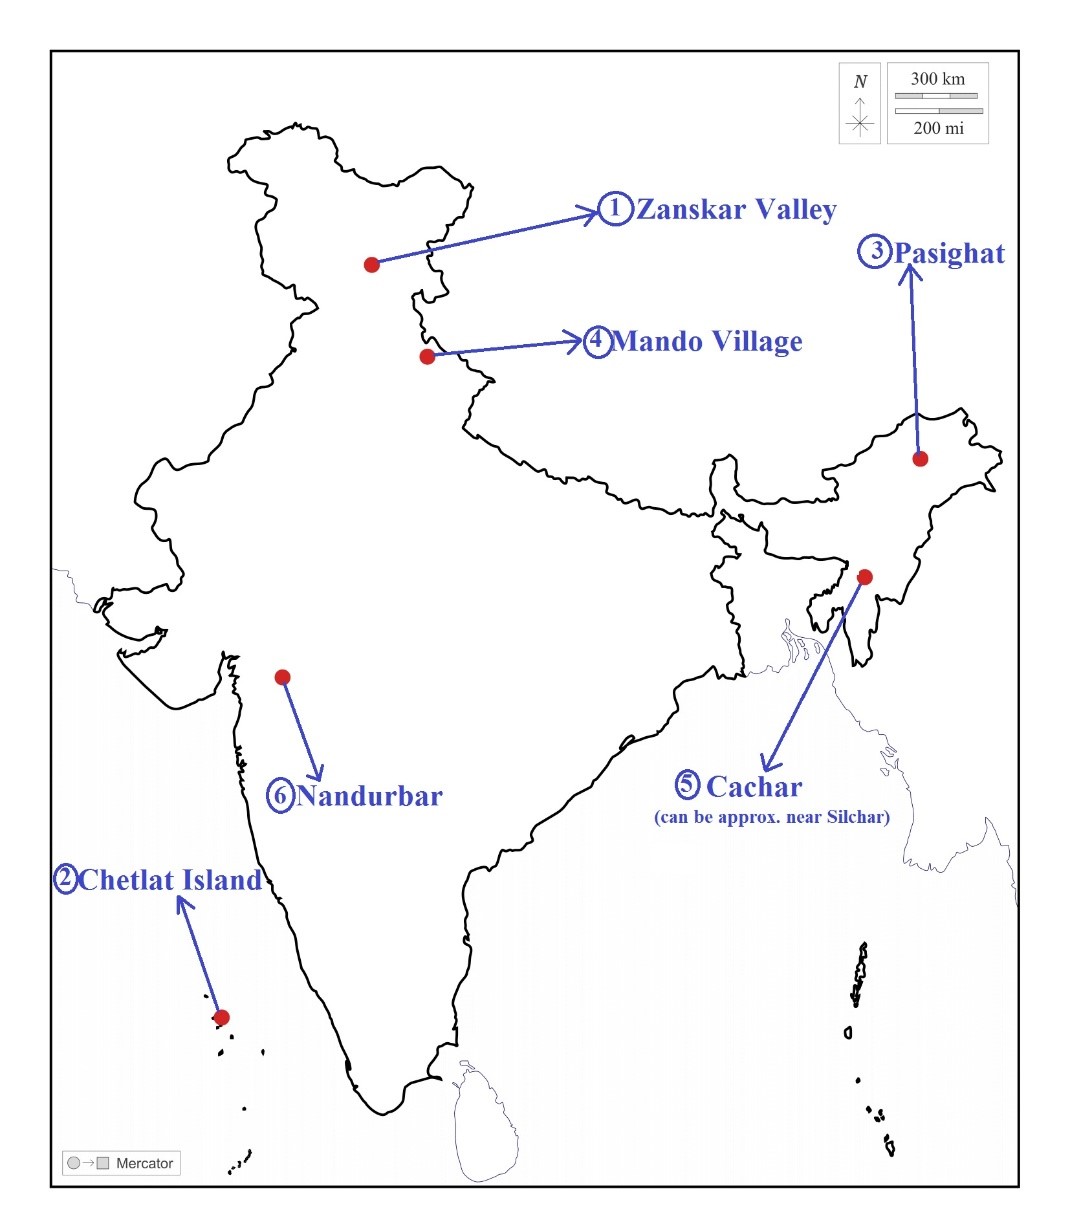
Zanskar Valley
|
Zanskar Valley:
|
|
Chetlat island:
|
|
Pasighat:
|
|
Mando Village:
|
|
Cachar:
|
|
Nandurbar:
|
Share the article
Get Latest Updates on Offers, Event dates, and free Mentorship sessions.

Get in touch with our Expert Academic Counsellors 👋
FAQs
Geography Current Affairs focuses on the contemporary issues, events, and developments in the field of geography. It covers recent geographical phenomena, environmental changes, geopolitical shifts, and related news. This differs from regular geography studies which may focus more on foundational concepts, historical contexts, and theoretical frameworks.
Updates are provided regularly to ensure that subscribers stay informed about the latest developments in geography. Typically, updates are provided on a fortnightly basis, depending on the frequency of significant events and changes in the field.
Absolutely. Geography Current Affairs serves as a valuable resource not only for Geography optional but also for GS papers, especially GS Paper 1 (covering Indian Heritage and Culture, History, and Geography of the World and Society) and GS Paper 3 (covering Technology, Economic Development, Biodiversity, Environment, Security, and Disaster Management). It aids in building a holistic understanding of various topics and strengthens answer-writing skills by incorporating contemporary examples and perspectives.
Geography Current Affairs holds immense importance for UPSC preparation, particularly for aspirants opting for Geography optional. It helps candidates stay updated with the latest developments, geographical phenomena, environmental issues, and geopolitical shifts worldwide, aligning them with the dynamic nature of the subject as tested in the UPSC examinations.

