
10 Nov to 24 Nov, 2025
GLOBAL CO 2 EMISSIONS REACHED
Why in news : India’s carbon dioxide emissions from fossil fuels are projected to rise by only 1.4% in 2025, a sharp slowdown from the 4% increase recorded in 2024, according to the Global Carbon Project (GCP) 2025 study.
About :
India’s Emissions Trajectory: A Brief Historical Overview (1990–2024)
Overall Trend (1990–2024)
- India’s CO₂ emissions rose from ~0.6 billion tonnes (1990) to ~2.8 billion tonnes (2024).
- Growth mainly driven by economic expansion, urbanisation, and industrialisation.
- Emissions grew rapidly during 2000–2015 due to electricity demand and coal-fired power capacity.

India’s Share of Global Emissions vs. Per Capita Emissions
Global Share
- India is the 3rd-largest emitter globally at about 7% of world CO₂ emissions (2024).
- But its cumulative emissions share since the Industrial Revolution is only ~3%, much lower than the US and EU.
Per Capita Emissions
- India’s per capita emissions are ~2.0 tonnes/person (2024),
compared to: - US: ~14–15 tonnes/person
- China: ~8 tonnes/person
- EU: ~6 tonnes/person

What Explains the Sharp Slowdown in 2025?
Renewable Energy Expansion
- Rapid growth of clean energy is slowing India’s emissions rise.
India added ~18–20 GW of solar capacity in 2024, making it the third-largest solar generator globally. - Wind-solar hybrid parks in Gujarat and Rajasthan ensure round-the-clock renewable power, reducing reliance on peak-hour coal.
- Green hydrogen pilots (e.g., NTPC’s hydrogen bus in Ladakh and Gail’s hydrogen blending trials) indicate a future shift in hard-to-abate sectors.
- Due to this transition, coal-based capacity addition has fallen from 20 GW per year (2010–12) to less than 4–5 GW (2023–24).
Slower Power Demand Growth
- Post-pandemic, electricity demand growth stabilized at 5–6%, compared to 8–10% during the 2014–2019 economic expansion phase.
- Efficiency improvements—LED penetration (Ujala: 36 crore LEDs distributed) and super-efficient appliances—have reduced household electricity load.
- Industries adopting energy-efficient processes under PAT have cut energy intensity by 3% annually in sectors like cement and aluminium.
Policy Interventions
- Renewable Purchase Obligations (RPOs) pushed DISCOMs to buy more green power, raising renewable share in the grid to ~27% (2024).
- Green Energy Corridor projects added ~10,000 km of transmission lines dedicated to renewable evacuation, reducing curtailment.
- Transport emissions slowed due to EV adoption: India saw >1.5 million EV sales in 2024, with cities like Delhi operating over 1,800 e-buses.
- Efficiency schemes:
- PAT saved ~9 million tonnes of CO₂ in its last cycle.
- ECBC improved building energy savings by 20–30% in compliant states.
Structural Economic Shifts
- India’s economy is gradually moving from energy-intensive manufacturing to service-led growth (services contribute ~54% of GDP), naturally lowering emission intensity.
- Expansion of the digital economy—IT services, fintech, digital payments (UPI: 12 billion monthly transactions)—requires less energy per unit of GDP compared to heavy industries like steel or cement.
International & Market Factors
- Volatile global fossil fuel prices (e.g., LNG price spike in 2022) encouraged India to rely more on domestic renewables and efficiency.
- Growing global preference for ESG-linked investments shifted private capital from coal power to solar, green hydrogen, and battery storage.
Example: India attracted $7–8 billion in clean energy FDI in 2023 alone.
Environmental Significance of the Slowdown
Influence on India’s Carbon Budget
- A slower emission growth rate (1.4% in 2025 vs. 4% in 2024) helps India preserve its limited carbon space for future development.
- India’s remaining carbon budget (for staying within a 1.5°C pathway) is already tight—estimated at less than 45–50 billion tonnes cumulatively.
- For example, the renewable shift in states like Rajasthan and Karnataka has reduced dependence on coal, helping maintain low growth in national emissions while still supporting economic expansion.
Impacts on Air Quality
- Reduced coal consumption directly lowers SO₂, NOx, and PM2.5 emissions, improving regional air quality.
- Coal power plants account for ~45% of India’s SO₂ emissions and ~30% of NOx.
- Even marginal reductions in coal output (due to increased solar/wind share) lead to local improvements.
- Example:
- Delhi–NCR saw slight reductions in winter SO₂ levels after nearby units like Dadri adopted cleaner operations and renewable integration.
Influence on Climate Mitigation Pathways
Alignment with India’s 2070 Net-Zero Target
- Slower emission growth means India can enter its peak-emissions phase earlier, making the net-zero trajectory more realistic.
- It supports India’s NDC target of 45% reduction in emissions intensity of GDP by 2030.
Strengthening Long-Term Low-Emission Development Strategy (LT-LEDS)
- With a slower rise in emissions, India can redirect resources toward:
- large-scale battery storage
- industrial green hydrogen
- carbon markets under the Carbon Credit Trading Scheme
- Example: India’s LT-LEDS presented at COP27 stresses renewable-led industrial decarbonization; the recent slowdown supports this vision.
Improved Feasibility for Sectoral Transitions
- Power sector transition becomes easier as renewable capacity ramps up.
- Hard-to-abate sectors (cement, steel) gain time to adopt technologies like green steel, carbon capture, and bioenergy with CCS.

How This Trend Positions India Globally
Geopolitical Influence
- The slowdown in emission growth strengthens India’s long-standing claim of “Common but Differentiated Responsibilities (CBDR)”, as India’s per capita emissions remain just ~2 tonnes, far below the US (15 t) and China (8 t).
- India gains stronger leverage in global climate negotiations, arguing that it is decarbonising faster relative to its income level.
- This enhances bargaining power for climate finance—India demands $1 trillion by 2030, and its moderated emission trajectory adds moral weight to this demand.
Leadership in Global South Climate Discourse
- India becomes a demonstration model for emerging economies by showing how large developing nations can expand GDP while slowing emission growth.
- Initiatives like the International Solar Alliance (ISA) and Global Biofuel Alliance (2023) position India as a climate leader for the Global South, promoting accessible low-carbon strategies.
Investment Effects
- A moderated fossil trajectory signals policy stability and attracts green finance.
- India drew $7–8 billion in clean energy FDI in 2023–24, with global firms like TotalEnergies, BlackRock, and Brookfield investing in solar, storage, and hydrogen.
- This also accelerates technology transfer—example: Adani–Total hydrogen JV and Reliance partnerships with global electrolyser firms.
Way Forward: Policy and Technological Pathways
Strengthening Renewable Energy Integration
- To support high renewable penetration, India must expand battery storage (target: 47 GW by 2030), pumped hydro (e.g., Pinna–Nadi PHES, Andhra Pradesh), and smart grids that reduce curtailment and manage intermittency.
Accelerating Transport Decarbonization
- Urban adoption of e-buses—Delhi now operates 1,800+ electric buses—can drastically cut urban transport emissions.
- Expanding EV charging corridors on national highways and deploying green hydrogen trucks for long-distance freight can decarbonise heavy transport.
Decarbonizing Industry
- India can reduce industrial emissions by promoting green steel (hydrogen-based DRI), green ammonia for fertilisers, and circular economy models.
- Example: JSW Steel’s green hydrogen trials and Tata Steel’s scrap-based “circular steel” initiatives.
Strengthening Climate Governance
- Operationalizing carbon markets under CEMEP (Carbon Credit Trading Scheme) can push industries to adopt cleaner technologies.
- State-level climate budgeting—adopted by Kerala and Assam—helps integrate climate risks into annual financial planning.
Community & Behavioural Transitions
- Wider adoption of efficient appliances (over 36 crore LEDs distributed under UJALA) and demand-side management can flatten peak load.
- Sustainable urban design—compact cities, transit-oriented development, and green buildings—reduces long-term energy demand.
https://globalcarbonbudget.org/fossil-fuel-co2-emissions-hit-record-high-in-2025/
Where to use :
Paper III ( General Studies ) : Environment and Conservation
SOLAR STORMS AND SOLAR FLARES
Why in news : Recent Solar storms and coronal mass ejections (CMEs) during the heightened Solar Cycle produced colourful lights in the Northern Hemisphere, visible far from the Arctic region.
About :
What Are Solar Storms and CMEs?
Solar Storms
Solar storms are disturbances originating from heightened activity on the Sun’s surface, often triggered by:
- Solar flares
- Coronal mass ejections
- High-speed solar wind streams
These storms release electromagnetic radiation and charged particles at high velocity.
Coronal Mass Ejections (CMEs)
CMEs are large eruptions of plasma and magnetic fields from the Sun’s corona.
- They eject billions of tonnes of charged particles.
- Speeds can reach 1,000–2,000 km/s.
- When directed toward Earth, they interact with Earth’s magnetosphere, producing strong geomagnetic storms.
Solar Cycle 25: Why Activity Is Increasing
The Sun follows an 11-year activity cycle. Solar Cycle 25 (begun in 2019) is currently in its ascending phase, expected to peak around 2025–26.
- During this phase, the number of sunspots, flares, and CMEs increases dramatically.
- NOAA’s Space Weather Prediction Center reported one of the strongest CMEs in decades in 2024–25.
This heightened solar phase explains the recent high-frequency, high-intensity solar storms.
Why Auroras Were Visible Far from the Arctic
Traditionally, auroras—Aurora Borealis (north) and Aurora Australis (south)—are limited to high-latitude regions like Norway, Alaska, or Siberia.
But during strong geomagnetic storms, Earth’s magnetic field is compressed, allowing charged particles to penetrate lower latitudes.
Recent Example (2024–25 Event):
- Auroras were visible in Germany, Poland, France, the UK, northern US states, and even parts of China
- Some reports indicated faint auroral activity as low as latitude 40°N, which is exceptionally rare.
This demonstrates that the recent solar storms reached G4–G5 intensity (severe geomagnetic storms).
Scientific Mechanism Behind the Auroras
When CME particles reach Earth:
- They are guided along magnetic field lines.
- Particles collide with atmospheric gases—oxygen and nitrogen.
- These gases emit light, creating auroral colors.
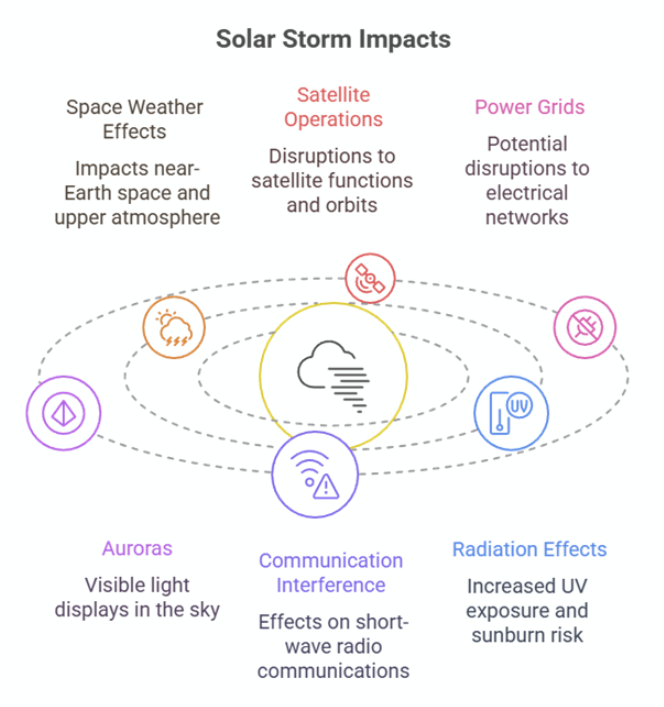
Potential Impacts of Strong Solar Storms
Though the auroras were beautiful, intense CMEs carry risks:
Satellite Damage
- CMEs can heat Earth’s upper atmosphere, increasing drag on satellites.
- Example: SpaceX lost 40 Starlink satellites in February 2022 due to solar-induced drag.
Disruption of Communications
- HF radio, aviation communication, and GPS signals face interference.
- Aircraft flying over polar routes often have to divert during strong storms.
Power Grid Disturbances
- Strong storms induce currents in long transmission lines.
- Historical example: 1989 Quebec blackout caused by a geomagnetic storm.
Impact on Astronaut Safety
- Higher radiation exposure risks for ISS astronauts and future lunar missions.

Environmental and Scientific Significance
Magnetic Reconnection
- Magnetic reconnection occurs when the Sun’s magnetic field carried by CMEs interacts with Earth’s magnetic field and breaks/reconnects.
- This releases huge bursts of energy, driving geomagnetic storms and auroras.
- Example: During the May 2024 storm, strong reconnection allowed solar particles deep into Earth’s magnetosphere, causing auroras at mid-latitudes.
Charged Particle Acceleration
- Solar storms accelerate electrons and protons to very high speeds.
- These particles spiral along Earth’s magnetic field lines and crash into atmospheric gases, creating auroras.
- The same accelerated particles can damage satellites by charging their surfaces.
Magnetosphere–Ionosphere Coupling
- The magnetosphere (Earth’s magnetic shield) and ionosphere (upper atmosphere filled with charged particles) interact strongly during solar storms.
- Energy from solar particles flows into the ionosphere, causing:
- increased currents (electrojets)
- disturbances in GPS and radio signals
- Example: During strong CMEs, polar air traffic is rerouted because HF communication becomes unreliable.
Conclusion:
The recent solar storms and CMEs during the peak of Solar Cycle 25 generated unusually widespread auroral displays, extending deep into the mid-latitudes. While visually stunning, these events highlight the powerful interactions between the Sun and Earth’s magnetic field, offering both scientific opportunities and technological challenges. With satellites like Aditya-L1, global monitoring networks, and advanced forecasting systems, humanity is better prepared—but the need for space-weather resilience continues to grow as solar activity intensifies.
Source : https://www.rmg.co.uk/stories/space-astronomy/what-causes-northern-lights-aurora-borealis-explained
https://svs.gsfc.nasa.gov/gallery/solar-cycle25/
Where to use :
Paper I ( General Studies ) : Universe and Solar System
DISASTERS AND WARNING IN HIMALAYAS
Why in news : Rising frequency of disasters in the Himalayan region has underscored the urgent need for robust Early Warning Systems (EWS) to predict and mitigate such events.
About :
The Himalayan region—stretching across India, Nepal, Bhutan, and China—has witnessed a sharp rise in disasters such as landslides, cloudbursts, glacial lake outburst floods (GLOFs), avalanches, and earthquakes.
Recent events like the 2023 Sikkim GLOF, 2021 Chamoli disaster, 2023 Himachal Pradesh cloudburst floods, and frequent landslides in Uttarakhand reflect the region’s growing vulnerability.
This escalating frequency underscores the urgent need for robust Early Warning Systems (EWS) to reduce losses and build climate resilience in fragile mountain ecosystems.

Why Are Disasters Increasing in the Himalayas?
Climate Change Intensifying Hazards
- Warming rate in the Himalayas is almost 0.6°C higher than the global average.
- Leads to rapid glacier melt → formation and expansion of unstable glacial lakes.
- Increased moisture → more extreme rainfall events, often concentrated within a few hours (cloudbursts).
Geomorphological Fragility
- Young, rising mountains → high slope instability.
- High seismicity: The Himalayas lie in Seismic Zones IV and V.
Human-Induced Pressures
- Road construction and tunnel projects (e.g., Char Dham project) destabilizing slopes.
- Unregulated tourism, quarrying, riverbed mining, and hydropower projects add stress.
Components of an Effective Himalayan EWS
Real-Time Monitoring
- Automatic Weather Stations (AWS) measuring rainfall intensity.
- River gauge sensors for flash-flood alerts.
- Landslide Early Warning using inclinometers, ground-motion sensors, and rainfall thresholds.
- Glacial Lake Monitoring using LIDAR, drones, and satellite imagery (ISRO’s NISAR, Sentinel-2).
Hazard Modelling & Risk Mapping
- Flood modelling using GIS and hydrodynamic models.
- Glacial lake hazard mapping → National Glacial Lake Inventory (2023) identifies >2,000 Himalayan glacial lakes with 56 “potentially dangerous”.
Communication Systems
- Mobile alerts (Cell Broadcast System).
- Sirens in vulnerable valleys (used in Sikkim Teesta basin).
- Village-level volunteers trained under Aapda Mitra Scheme.
Community Preparedness
- Evacuation drills, mock exercises.
- Local response teams in remote Himalayan villages.
- School safety programs.
Major Gaps & Challenges
- Sparse Monitoring Network : High-altitude valleys lack real-time sensors due to difficult terrain.
- Data Sharing Barriers: Multiple agencies (ISRO, CWC, IMD, BRO, state DMAs) work in silos.
- Infrastructure Damage: Sensors often fail during extreme weather or due to snow/landslides.
- Technological Limitations
- Lack of predictive rainfall models for cloudbursts.
- Poor last-mile connectivity in remote Himalayan settlements.
Way Forward: Strengthening Himalayan EWS
Denser Sensor Networks
- Install high-altitude AWS, rainfall radars (Doppler Radar Network).
- Expand glacial lake instrumentation, especially in Sikkim, Uttarakhand, and Himachal.
Next-Generation Technologies
- AI-based hazard prediction models (used in Nepal and Switzerland).
- Satellite-based IoT sensors for remote valleys.
- Real-time drone mapping of unstable slopes.
Community-Centric Approaches
- Build village disaster committees and local volunteers.
- Use vernacular languages for alerts.
- Promote safe construction practices and slope management.
Strengthen Institutional Coordination
- Integrated Himalayan Disaster Management Platform combining:
- IMD weather models
- ISRO satellite data
- CWC flood forecasting
- Forest & Wildlife inputs (for landslide triggers)
Build Climate-Resilient Infrastructure
- Slope stabilization using bioengineering (e.g., vetiver grass).
- Restrict construction in hazard-prone zones.
- Environmental Impact Assessments must consider cumulative impacts in mountain valleys.
Where to use :
Paper III ( General Studies ) : Disaster management
Tropical Forest Forever Facility (TFFF)
Tropical Forest Forever Facility (TFFF) : The Tropical Forest Forever Facility is a global fund idea that aims to protect tropical forests like the Amazon, Congo, and Southeast Asian rainforests by giving countries long-term financial support. The money helps them reduce deforestation, promote sustainable livelihoods, and conserve biodiversity. The main idea is that forests provide climate benefits to the whole world, so the world should help tropical countries protect them permanently.
Soil Organic Carbon
Soil Organic Carbon : Soil Organic Carbon (SOC) is the carbon stored in soil from plant roots, leaves, crop residues, and microorganisms. It helps soil stay healthy by improving water retention, fertility, and structure. High SOC means better crop growth and less soil erosion. Climate-wise, SOC is important because soil acts as a carbon sink, removing carbon dioxide from the atmosphere and storing it in the ground.
Speciality Fertilisers
Speciality Fertilisers : Speciality fertilisers are advanced fertilisers designed to release nutrients slowly or in a targeted way so plants can absorb them better. Examples include water-soluble fertilisers, nano-urea, and controlled-release fertilisers. They reduce wastage, improve crop productivity, and lower environmental pollution compared to normal fertilisers. Farmers use them especially in high-value crops like fruits, vegetables, and flowers.
Tractor Emission Norms
Tractor Emission Norms: Tractor emission norms are government rules that limit the amount of smoke, particulate matter, and harmful gases that tractors can release. India follows standards similar to Bharat Stage norms used for cars. Newer norms make tractor engines cleaner and more fuel-efficient by improving combustion and reducing pollutants. This helps reduce air pollution in rural areas and supports cleaner agricultural practices.
Oligotrophication
Oligotrophication : Oligotrophication is the process where a lake or water body becomes low in nutrients, especially nitrogen and phosphorus. When nutrients drop too much, algae and aquatic plants decline, fish find less food, and the ecosystem becomes less productive. It is the opposite of eutrophication. Oligotrophication can happen naturally in old lakes, or due to strict pollution control and reduced nutrient inflow from farms and towns.
SOCIAL FORESTRY IN ARABARI , WEST BENGAL
Arabari became one of India’s earliest and most successful Social Forestry / Joint Forest Management (JFM) models.
In the 1970s, the area was highly degraded sal forest, facing illegal felling, soil erosion, and loss of livelihood opportunities.
Key Interventions
- Community Participation
- In 1972, the Forest Department collaborated with 618 villagers of Arabari.
- The community agreed to protect and regenerate forest areas in exchange for 25% share in final timber harvest and free access to minor forest produce.
- Plantation & Regeneration
- Over 1,200 hectares of degraded land were planted with Sal (Shorea robusta), Acacia, Eucalyptus, and fodder grasses.
- Soil and moisture conservation activities such as bunding and trenching were carried out.
- Protection Measures
- Village forest committees monitored illegal grazing, felling, and fires.
- Participatory patrolling was introduced to reduce forest offences.

Where to use:
Paper I ( Geography Optional ) : Social Forestry , Joint Forest Management .
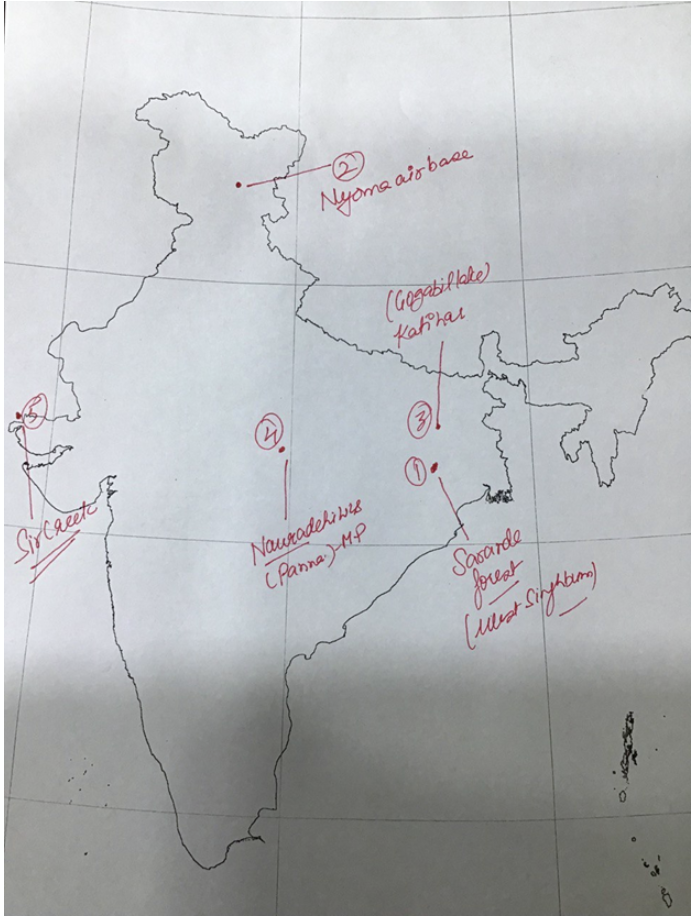
Places in News - 24 November 2025
1. Saranda Forest
Why in news : The Supreme Court of India directed the Jharkhand government to declare 31,468.25 hectares of the Saranda forest area as a wildlife sanctuary. The court reaffirmed that mining is prohibited inside national parks and wildlife sanctuaries, as well as within a one-kilometre buffer from their boundaries.
About :
- It is the largest Sal forest in Asia, located near Jamshedpur, Jharkhand. The name “Saranda” means “land of seven hundred hills”, spread over around 900 sq. km.
- It historically served as the private hunting ground of the royal family of Seraikela.
- The Saranda forest division also accounts for 26% of India’s iron ore reserves, making it both ecologically and economically significant.
- Flora: Dominated by Sal (Shorea robusta), forming one of the most pristine and continuous Sal forests in the world. Other major species include Mahua and Kusum.
- Supports diverse deciduous vegetation that maintains water cycles and contributes to carbon sequestration.
- Fauna: It is the habitat for critically endangered and endemic species, including the sal forest tortoise, four-horned antelope, and Asian palm civet.
- The forest is home to endangered species of flying lizards and hundreds of elephants.
- Tribes: Inhabited by Ho, Munda, Uraon, and allied Adivasi communities. Their livelihoods, culture, and subsistence practices are deeply linked to forest resources.
2. Nyoma Air base
Why in news : India has inaugurated its newest and highest fighter-capable airbase at Nyoma in Ladakh, built by the Border Roads Organisation (BRO), marking a major boost to the country’s air power along the northern front.
About :
- Nyoma lies at 13,700 feet, making it one of the world’s highest fighter-capable airbases.
- Located only 35 km from the Line of Actual Control (LAC), it gives India rapid-response capability against China.
- It strengthens India’s forward military posture after the Chinese People's Liberation Army (PLA) troop buildup in eastern Ladakh (2020).
- The base will significantly boost air infrastructure in Ladakh and enhance the Indian Air Force's (IAF) ability to respond quickly to any aerial threats along the northern frontier.
- Key Capabilities of the Nyoma Base: It supports fighter jet operations, unlike the earlier limited-use airstrip. Enhances surveillance, mobility, and logistics in a strategically sensitive region.
3. Gogabil Lake
Why in news : Bihar now has six Ramsar sites, placing it third after Tamil Nadu and Uttar Pradesh. India has the highest number of Ramsar sites in Asia and ranks third globally after the UK (176) and Mexico (144), under the Ramsar Convention, 1971.
About :
- Gogabil Lake is an ox-bow wetland located in the Trans-Gangetic Plains of Katihar, Bihar. It is flanked by the Mahananda River to the northeast and the Ganga River to the south.
- Gogabil Lake is Bihar’s first Community Reserve. It is the 15th Protected Area (PA) in Bihar.
- It is used for irrigation water abstraction, extensive fishing, navigation, cattle wading, and recreation, supporting local livelihoods.
- Ecological Importance: Gogabil is a permanent waterbody that shrinks in summer but never dries, and it is an important wintering site along the Central Asian Flyway.
- Flora and Fauna: It hosts large congregations of waterbirds and shoreline birds. It supports bird species such as Red-crested Pochard, Common Pochard, Bar-headed Goose, Greylag Goose, Northern Pintail, and Ruddy Shelduck.
- Endangered and rare species recorded here include the Black-bellied Tern, Lesser Adjutant Stork, River Tern, Painted Stork, Ferruginous Duck, Darter, and Black-headed Ibis.
- Due to its high avian diversity and ecological richness, Gogabil is recognised as an Important Bird Area.
4. Nauradehi Wildlife Sanctuary (NWS)
Why in news : Nauradehi Wildlife Sanctuary (NWS) in Madhya Pradesh is being prepared as India’s third cheetah site.
About :
- It is the largest wildlife sanctuary in Madhya Pradesh, declared in 1975. The entire Sanctuary is situated on the upper Vindhyan plateau within the Deccan Peninsula biogeographic region.
- Connectivity: NWS acts as a corridor for Panna Tiger Reserve and Satpura Tiger Reserve while indirectly connecting Bandhavgarh Tiger Reserve via Rani Durgawati Wildlife Sanctuary.
- Habitat & Forests: The area is dominated by Tropical Dry Deciduous forests of the central Indian monsoon zone.
- Flora: Teak is the main species, along with Saja, Dhaora, Bhirra, Mahua, Tendu, Ber, Bel, Gunja, and Amla.
- Fauna: It hosts tiger, leopard, wild dog, sloth bear, and Indian wolf (Canis lupus pallipes), alongside nilgai, chinkara, spotted deer, sambar, and blackbuck.
- The Indian wolf is recognised as the sanctuary’s keystone species, reflecting its strong canid presence.
- Birdlife exceeds 170 species, and crocodiles occur in the Bamner river.
- Rivers & Drainage: Three fourth of Nauradehi Wildlife Sanctuary falls in the Yamuna (Ganges) basin and one fourth of the sanctuary falls in the Narmada basin.
5. Sir creek
Why in news : India has begun Tri-Services Exercise “Trishul-2025” to strengthen integrated operations across land, air, and sea in the Sir Creek and desert sectors of Rajasthan–Gujarat, extending into the northern Arabian Sea.
About :
- It is a narrow, tidal estuary located in the Rann of Kutch, forming part of the India–Pakistan boundary between Gujarat (India) and Sindh (Pakistan). It is about 96 km long and opens into the Arabian Sea.
- Determines maritime boundary and EEZ limits in the Arabian Sea.
- Rich in fish resources; fishermen from both countries often stray due to no clear demarcation.
- Possible offshore oil and gas potential adds to its relevance.
Fortnightly KOSMOS MCQs Practice - 24th November 2025
Q1. Consider the following statements regarding the recent UN report on global ocean temperatures:
1. The report states that 2024 has recorded the highest average ocean surface temperature since records began.
2. Rising ocean temperatures are directly linked to increased frequency of cyclones.
Which of the above statements is/are correct?
- 1 only
- 2 only
- Both 1 and 2
- Neither 1 nor 2
Q2. Consider the following statements about the newly discovered plant species in the Western Ghats:
1. The species is endemic to the Nilgiri Biosphere Reserve.
2. It was discovered by a team from the Botanical Survey of India.
3. The plant has medicinal properties recognized by Ayurveda.
Which of the above statements is/are correct?
- 1 and 2 only
- 2 and 3 only
- 1 and 3 only
- All of the above
Q3. With reference to the recent heatwave in North India, consider the following statements:
1. The IMD has classified the event as a ‘severe heatwave’.
2. Urban heat islands have contributed to higher temperatures in metropolitan areas.
3. The heatwave has led to a significant increase in forest fires in Uttarakhand.
Which of the above statements is/are correct?
- 1 and 2 only
- 2 and 3 only
- 1 and 3 only
- All of the above
Q4. Consider the following statements regarding the recent ban on single-use plastics in a South Asian country:
1. The ban covers plastic bags, straws, and cutlery.
2. India is the country that announced the ban.
3. The move is expected to reduce marine pollution significantly.
Which of the above statements is/are correct?
- 1 and 3 only
- 2 and 3 only
- 1 only
- All of the above
Q5. Recently, a new Ramsar site was designated in India. Consider the following statements:
1. The site is located in Assam.
2. It is a freshwater wetland.
3. The designation aims to protect migratory bird habitats.
Which of the above statements is/are correct?
- 1 and 2 only
- 2 and 3 only
- 1 and 3 only
- All of the above
Q6. Consider the following statements about the recent earthquake in the Himalayan region:
1. The epicenter was located near the Indo-Nepal border.
2. The earthquake measured above 6.0 on the Richter scale.
3. It triggered landslides in the region.
Which of the above statements is/are correct?
- 1 and 2 only
- 2 and 3 only
- 1 and 3 only
- All of the above
Q7. With reference to the Global Biodiversity Framework adopted recently, consider the following statements:
1. It aims to protect 30% of the world’s land and oceans by 2030.
2. India is a signatory to the framework.
3. The framework is legally binding on all member countries.
Which of the above statements is/are correct?
- 1 and 2 only
- 2 and 3 only
- 1 and 3 only
- All of the above
Q8. Consider the following statements about the recent cyclone in the Bay of Bengal:
1. The cyclone was named ‘Remal’.
2. It made landfall on the eastern coast of India.
3. The cyclone led to widespread flooding in Bangladesh.
Which of the above statements is/are correct?
- 1 and 3 only
- 2 and 3 only
- 1 and 2 only
- All of the above
Q9. With reference to the recent desertification report by UNCCD, consider the following statements:
1. India is among the top five countries affected by desertification.
2. The report highlights overgrazing as a major cause.
3. The Thar Desert is expanding at an alarming rate.
Which of the above statements is/are correct?
- 1 and 2 only
- 2 and 3 only
- 1 and 3 only
- All of the above
Q10. Consider the following statements regarding the recent launch of a satellite for climate monitoring:
1. The satellite was launched by ISRO.
2. It will monitor greenhouse gas emissions over South Asia.
3. The satellite is equipped with hyperspectral imaging technology.
Which of the above statements is/are correct?
- 1 and 2 only
- 2 and 3 only
- 1 and 3 only
- All of the above
Share the article
Edukemy’s Current Affairs Quiz is published with multiple choice questions for UPSC exams
MCQ
Get Latest Updates on Offers, Event dates, and free Mentorship sessions.

Get in touch with our Expert Academic Counsellors 👋
FAQs
Geography Current Affairs focuses on the contemporary issues, events, and developments in the field of geography. It covers recent geographical phenomena, environmental changes, geopolitical shifts, and related news. This differs from regular geography studies which may focus more on foundational concepts, historical contexts, and theoretical frameworks.
Updates are provided regularly to ensure that subscribers stay informed about the latest developments in geography. Typically, updates are provided on a fortnightly basis, depending on the frequency of significant events and changes in the field.
Absolutely. Geography Current Affairs serves as a valuable resource not only for Geography optional but also for GS papers, especially GS Paper 1 (covering Indian Heritage and Culture, History, and Geography of the World and Society) and GS Paper 3 (covering Technology, Economic Development, Biodiversity, Environment, Security, and Disaster Management). It aids in building a holistic understanding of various topics and strengthens answer-writing skills by incorporating contemporary examples and perspectives.
Geography Current Affairs holds immense importance for UPSC preparation, particularly for aspirants opting for Geography optional. It helps candidates stay updated with the latest developments, geographical phenomena, environmental issues, and geopolitical shifts worldwide, aligning them with the dynamic nature of the subject as tested in the UPSC examinations.